
M. -L. Timmermans1, A. Proshutinsky2
1Yale University, New Haven, CT, USA
2Woods Hole Oceanographic Institution, Woods Hole, MA, USA
Highlights
- Sea surface temperatures (SSTs) in August 2015 off the west coast of Greenland (eastern Baffin Bay) and in the Kara Sea were up to +4°C warmer than the 1982-2010 August mean in these regions.
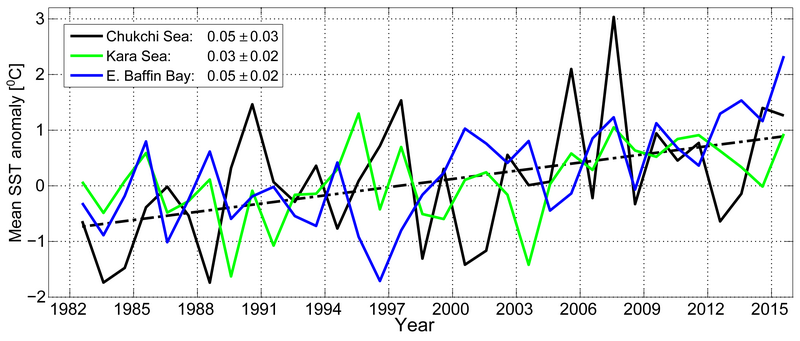
- The Chukchi Sea and eastern Baffin Bay show the largest ocean surface warming trends; August SSTs are increasing at ~0.5°C/decade in these regions.
- In the Arctic Basin, spatial patterns of August 2015 SST anomalies relative to the 1982-2010 August mean are linked to regional variability in sea-ice retreat.
Summer sea surface temperatures (SSTs) in the Arctic Ocean are set by absorption of solar radiation into the surface layer. In the Barents and Chukchi seas, there is an additional contribution from advection of warm water from the North Atlantic and Pacific oceans, respectively. Solar warming of the ocean surface layer is influenced by the distribution of sea ice (with more solar warming in ice-free regions), and by cloud cover, water color and upper-ocean stratification. August SSTs are an appropriate representation of Arctic Ocean summer SSTs and are not affected by the cooling and subsequent sea-ice growth that takes place in the latter half of September. Here we use SST data from the NOAA Optimum Interpolation (OI) SST Version 2 monthly product, which is a blend of in situ and satellite measurements available at the NOAA/OAR/ESRL PSD, Boulder, Colorado (Reynolds et al. 2002, 2007; http://www.esrl.noaa.gov/psd/data/gridded/data.noaa.oisst.v2.html).
Mean SSTs in August 2015 in ice-free regions ranged from ~0°C in some places to around +7 to +8°C in the Chukchi, Barents, and Kara seas and eastern Baffin Bay off the west coast of Greenland (Fig. 5.1a). August 2015 SSTs show the same general spatial distribution as the August mean for the period 1982-2010 (shown in Arctic Report Card 2014, Fig. 5.1a). The August 2015 SST pattern is also similar to that of recent years, e.g., 2012 (Fig. 5.1b), which was the summer of lowest minimum sea-ice extent in the satellite record (1979-present).
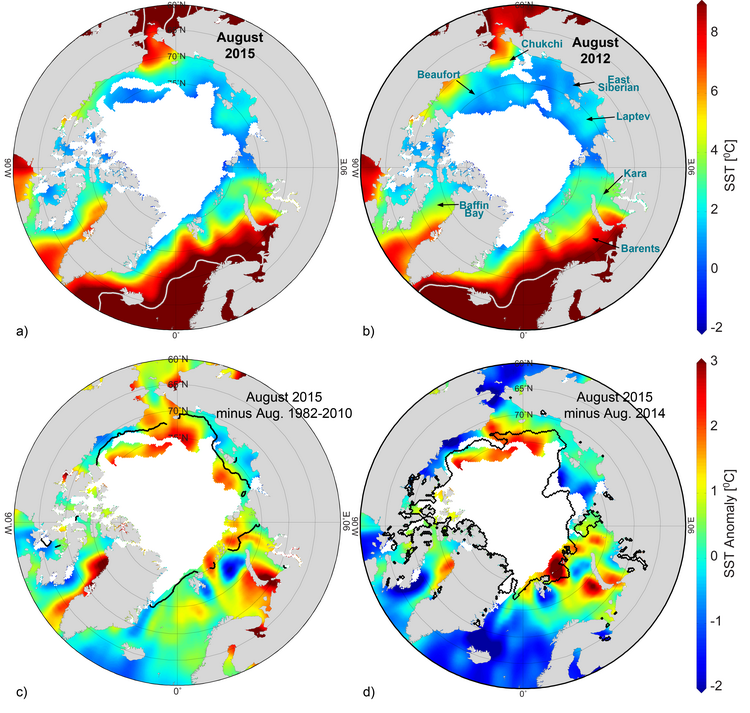
Most boundary regions and marginal seas of the Arctic had anomalously warm SSTs in August 2015 compared to the 1982-2010 August mean (Fig. 5.1c). SSTs in these seas, which are mostly ice-free in August, are linked to the timing of local sea-ice retreat; anomalously warm SSTs (up to +3°C relative to 1982-2010) in August 2015 in the Beaufort and Chukchi seas were associated with low sea-ice extents and exposure of surface waters to direct solar heating (Fig. 5.1c; see also the essay on Sea Ice). The relationship between warm SSTs and reduced sea-ice is further apparent in a comparison between August 2015 and August 2014 SSTs: anomalously warm regions (including to the east of Svalbard, where SSTs were up to +3°C warmer than 1982-2010) are associated with relatively lower sea-ice extents in 2015 compared to 2014 (Fig. 5.1d). Although SSTs were warmer in general, August 2015 SSTs were cooler relative to the 1982-2010 average in some regions, e.g., along the southern boundaries of the Beaufort and East Siberian seas (Fig. 5.1c), where summer air temperatures were also below average (see Fig. 1.2d in the essay on Air Temperature).
Anomalously warm August 2015 SSTs in eastern Baffin Bay are notable this year, with values as much as +4°C warmer than the 1982-2010 August mean; SSTs over the region indicate a general warming trend of about 0.5°C/decade since 1982 (Fig. 5.2). If only the past two decades are considered, the linear warming trend in the surface waters of eastern Baffin Bay is about 1°C/decade (+0.10 ± 0.05°C/year). Along the boundaries of the Arctic Basin, the only marginal seas to exhibit statistically significant warming trends are the Chukchi and the Kara seas. Chukchi Sea August SSTs are warming at a rate of about +0.5°C/decade, commensurate with declining trends in summer sea-ice extent in the region. In the Kara Sea, August 2015 SSTs were also around +4°C warmer than the 1982-2010 August mean; SSTs in this sea have warmed by about +0.3°C/decade since 1982. In other marginal seas, warm August SST anomalies observed in 2015 are of similar magnitude to warm anomalies observed in past decades (shown in Arctic Report Card 2014, Fig. 5.3).
References
Reynolds, R. W., N. A. Rayner, T. M. Smith, D. C. Stokes, and W. Wang, 2002: An improved in situ and satellite SST analysis for climate. J. Climate, 15, 1609-1625.
Reynolds, R. W., T. M. Smith, C. Liu, D. B. Chelton, K. S. Casey, and M. G. Schlax, 2007: Daily high-resolution-blended analyses for sea surface temperature. J. Climate, 20, 5473-5496.
Simmonds, I., 2013: [The Arctic] Sidebar 5.1: The extreme storm in the Arctic Basin in August 2012 [in “State of the Climate in 2012”]. Bull. American Met. Soc., 94(8), S114-S115.
November 25, 2015