
R. M. Holmes1, A. I. Shiklomanov2,3, S. E. Tank4, J. W. McClelland5, M. Tretiakov6
1Woods Hole Research Center, Falmouth, MA, USA
2University of New Hampshire, Durham, NH, USA
3Shirshov Institute of Oceanology, Moscow, Russia
4University of Alberta, Edmonton, AB, Canada
5University of Texas at Austin, Marine Science Institute, Port Aransas, TX, USA
6Arctic and Antarctic Research Institute, St. Petersburg, Russia
Highlights
- In 2014, combined discharge from the eight largest Arctic rivers (2,487 km3) was 10% greater than average discharge for the period 1980-1989. Values for 2013 (2,282 km3) and 2012 (2,240 km3) were 1% greater than and 1% less than the 1980-1989 average, respectively.
- For the first seven months of 2015, the combined discharge for the six largest Eurasian Arctic rivers shows that peak discharge was 10% greater and five days earlier than the 1980-1989 average for those months.
River discharge integrates hydrologic processes occurring throughout the surrounding landscape; consequently, changes in the discharge of large rivers can be a sensitive indicator of widespread changes in watersheds (Rawlins et al. 2010, Holmes et al. 2012). Changes in river discharge also impact coastal and ocean chemistry, biology and circulation. This interaction is particularly strong in the Arctic because rivers in this region transport >10% of global river discharge but the Arctic Ocean contains only ~1% of the global ocean volume (Aagaard and Carmack 1989, McClelland et al. 2012).
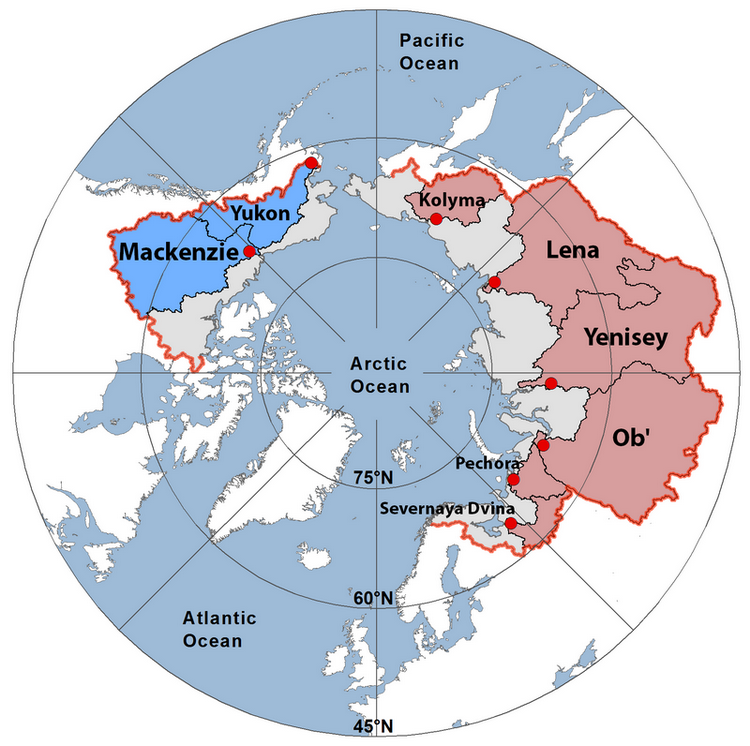
Here we report annual river discharge values for the eight largest Arctic rivers since 2011, when river discharge was last featured in the Arctic Report Card (Shiklomanov and Lammers 2011), and compare these recent observations to a 1980-1989 reference period (the first decade with data from all eight rivers). Six of the eight rivers lie in Eurasia, and the other two are in North America. Together, the watersheds of these eight rivers cover 70% of the pan-Arctic drainage area, so the rivers featured here account for the majority of riverine freshwater inputs to the Arctic Ocean (Fig. 8.1).
A long-term increase in Arctic river discharge has been well documented and is primarily a function of increasing precipitation linked to global warming (Peterson et al. 2002, McClelland et al. 2006, Shiklomanov and Lammers 2009, Overeem and Syvitski 2010, Rawlins et al. 2010). The long-term discharge trend is greatest for rivers of the Eurasian Arctic and constitutes the strongest evidence of intensification of the Arctic freshwater cycle (Rawlins et al. 2010).
The results presented here demonstrate that Eurasian Arctic river discharge generally declined between 2007 and 2012 and then began to increase again in 2013 and 2014 (Fig. 8.2, Table 8.1). The discharge increase seems to be continuing in 2015, as over the first seven months of 2015 the combined discharge of these rivers was 10% greater than the 1980-1989 average for those same months (Table 8.2). The short-term variability in Eurasian Arctic river discharge is consistent with previous increases and decreases over 4-6 year intervals in the past (Fig. 8.2). Overall, the most recent data indicate a continuing long-term increase in Eurasian Arctic river discharge.

| Discharge (km3/y) | |||||||||
|---|---|---|---|---|---|---|---|---|---|
| Yukon | Mackenzie | Pechora | S. Dvina | Ob’ | Yenisey | Lena | Kolyma | Sum | |
| 2014 | 227 | 272 | 116 | 91 | 448 | 640 | 607 | 86 | 2487 |
| 2013 | 213 | 311 | 82 | 97 | 372 | 527 | 600 | 80 | 2282 |
| 2012 | 232 | 306 | 103 | 117 | 300 | 458 | 665 | 59 | 2240 |
| Average 2010-2014 | 212 | 293 | 106 | 95 | 385 | 582 | 582 | 74 | 2329 |
| Average 2000-2009 | 207 | 305 | 124 | 103 | 415 | 640 | 603 | 78 | 2475 |
| Average 1990-1999 | 217 | 275 | 117 | 111 | 405 | 613 | 532 | 68 | 2338 |
| Average 1980-1989 | 206 | 273 | 108 | 100 | 376 | 582 | 549 | 68 | 2262 |
| Average 1970-1979 | 184 | 292 | 108 | 94 | 441 | 591 | 529 | 65 | 2304 |
| Average 1960-1969 | 112 | 98 | 376 | 546 | 535 | 73 | |||
| Average 1950-1959 | 110 | 108 | 380 | 566 | 511 | 74 | |||
| Average 1940-1949 | 102 | 100 | 424 | 578 | 498 | 72 | |||
| Average for Period of Record | 206 | 286 | 110 | 100 | 400 | 588 | 539 | 71 | 2300 |
For the North American Arctic rivers considered here (Yukon and Mackenzie), the combined discharge declined each year from 2012 to 2014, yet in each of those years the combined discharge was greater than the long-term average (Fig. 8.2, Table 8.1). Thus, as discussed for Eurasian rivers, these most recent data indicate a longer-term pattern of increasing river discharge (Fig. 8.2). Indeed the overall trends of increasing discharge since 1976 are remarkably similar for the North American and Eurasian rivers. Increases per decade since 1976 were 3.1±2.0% for the Eurasian rivers and 2.6±1.7% for the North American rivers. Increases per decade follow a Mann-Kendall trend analysis; error bounds are 95% confidence intervals for the trend.
Considering the eight Eurasian and North American Arctic rivers together, their combined discharge in 2014 (2487 km3) was 10% greater than average discharge from 1980-1989. Comparing 2014 to 2012, the combined discharge of these eight rivers was almost 250 km3 greater in 2014. For perspective, 250 km3 is approximately 14 times the annual discharge of the Hudson River, the largest river on the East Coast of the United States.
An assessment of the combined daily discharge of Eurasian Arctic rivers for the period January 1 through July 31 2015 reveals an earlier and higher peak discharge compared to the 1980-1989 average (Fig. 8.3, Table 8.2). The 2015 peak discharge for these six rivers was 10% higher and five days earlier than the 1980-1989 average. The higher and earlier discharge peak is consistent with the early spring melt of deeper snow in Eurasia (see the essay on Terrestrial Snow Cover).

| 1 January – 31 July Discharge (km3) | |||||||
| Pechora | S. Dvina | Ob’ | Yenisey | Lena | Kolyma | Sum | |
| 2015 | 95 | 51 | 290 | 447 | 421 | 51 | 1355 |
| 1980-1989 Ave. | 82 | 73 | 244 | 426 | 361 | 44 | 1229 |
References
Aagaard, K., and E. C. Carmack, 1989: The role of sea ice and other fresh water in the Arctic circulation. J. Geophys. Res. 94(C10): 14485-14498.
Holmes, R. M., M. T. Coe, G. J. Fiske, T. Gurtovaya, J. W. McClelland, A. I. Shiklomanov, R. G. M. Spencer, S. E. Tank, and A. V. Zhulidov, 2013: Climate change impacts on the hydrology and biogeochemistry of Arctic Rivers. Global Impacts of Climate Change on Inland Waters, edited by C. R. Goldman, M. Kumagai, and R. D. Robarts, Wiley, 3-26.
McClelland, J. W., S. J. Dery, B. J. Peterson, R. M. Holmes, and E. F. Wood, 2006: A pan-arctic evaluation of changes in river discharge during the latter half of the 20th century. Geophys. Res. Lett. 33, L06715, doi:06710.01029/02006GL025753.
McClelland, J. W., R. M. Holmes, K. H. Dunton, and R. Macdonald, 2012: The Arctic Ocean estuary. Estuar. Coast. 35, 353-368, doi:10.1007/s12237-010-9357-3.
Overeem, I., and J. P. M. Syvitski, 2010: Shifting discharge peaks in Arctic rivers, 1977-2007. Geogr. Ann., 92a, 285-296.
Peterson, B. J., R. M. Holmes, J. W. McClelland, C. J. Vorosmarty, R. B. Lammers, A. I. Shiklomanov, I. A. Shiklomanov, and S. Rahmstorf, 2002: Increasing river discharge to the Arctic Ocean. Science, 298, 2171-2173.
Rawlins, M. A., et al. 2010. Analysis of the arctic system freshwater cycle intensification: observations and expectations. J. Climate, 23, doi: 10.1175/2010JCLI3421.1.
Shiklomanov A. I., and R. B. Lammers, 2009: Record Russian river discharge in 2007 and the limits of analysis. Environ. Res. Lett. 4, doi: 10.1088/1748-9326/4/4/045015.
Shiklomanov, A. I., and R. B. Lammers, 2011: River Discharge. In Arctic Report Card: Update for 2011, ftp://ftp.oar.noaa.gov/arctic/documents/ArcticReportCard_full_report2011.pdf.
November 17, 2015