
K. E. Frey1, J. C. Comiso2, L. W. Cooper3, R. R. Gradinger4, J. M. Grebmeier3, J. -É. Tremblay5
1Graduate School of Geography, Clark University, Worcester, Massachusetts, USA
2Cryospheric Sciences Laboratory, NASA Goddard Space Flight Center, Greenbelt, MD, USA
3Chesapeake Biological Laboratory, University of Maryland Center for Environmental Science, Solomons, MD, USA
4Institute of Marine Research, Tromsø, Norway
5Québec-Océan and Takuvik, Biology Department, Université Laval, Québec City, QC, Canada
(See erratum, published in 2021)
Highlights
- Anomalously high chlorophyll-a concentrations were observed in 2015 in a number of locations. The most notable 2015 positive anomalies occurred in regions along the shelfbreak in the Bering Sea, southwest of Greenland in the Labrador Sea, and west of Novaya Zemlya in the Barents Sea during May; regions to the east of Greenland south of Fram Strait during June; and localized regions in the Siberian Kara and Laptev seas during July and August.
- The steepest increasing trends in chlorophyll-a concentrations during the period 2003-2015 occurred to the southwest of Greenland in the Labrador Sea and the eastern Barents Sea in May, and in the eastern Laptev Sea in July and August.
- Estimates of ocean primary productivity showed widespread positive anomalies for 2015. The highest anomalies for 2015 occurred in the Barents Sea (+16.98 g C/m2/yr, or 21.0%), the Sea of Okhotsk (+13.26 g C/m2/yr, or 18.3%), and Baffin Bay/Labrador Sea (+11.20 g C/m2/yr, or 20.2%). The lowest anomalies occurred in Hudson Bay (+0.31 g C/m2/yr, or 0.7%) and the western (North American) Arctic (+3.69 g C/m2/yr, or 10.2%).
- Statistically significant increasing primary productivity trends during the period 2003-2015 occurred in the eastern (Eurasian) Arctic, Barents Sea, Greenland Sea, and North Atlantic; the steepest trends were in the eastern Arctic (19.26 g C/m2/yr/dec, a 41.9% increase) and the Barents Sea (17.98 g C/m2/yr/dec, a 30.2% increase).
Introduction
Primary productivity is the rate at which atmospheric or aqueous carbon dioxide is converted by autotrophs (primary producers) to organic material. It occurs most commonly by photosynthesis (i.e., with light as an energy source) but it is also facilitated by chemosynthesis (i.e., using oxidation of methane or other reduced inorganic molecules as an energy source instead of light). Primary production via photosynthesis is a key process, as the producers form the base of the entire food web, both on land and in the oceans. Algae are responsible for nearly all photosynthesis occurring in the oceans, and measurements of the algal pigment chlorophyll (e.g. chlorophyll-a) serve as a proxy for the amount of algal biomass present as well as overall plant health. The oceans play a significant role in global carbon budgets via photosynthesis, as approximately half of all global net annual photosynthesis occurs in the oceans, with ~10-15% of production occurring on the continental shelves alone (Müller-Karger et al. 2005). In the Arctic, inflow shelves alone account for 75% of annual vertically integrated primary production yet only represent 50% of total Arctic Ocean open water (Hill et al. 2013). Furthermore, primary production is strongly dependent upon light availability and the presence of nutrients, and is thus highly seasonal in the Arctic region. In particular, the melting and retreat of sea ice during spring are strong drivers of primary production in the Arctic Ocean and its adjacent shelf seas by enhancing light availability (Barber et al. 2015, Leu et al. 2015).
Recent declines in Arctic sea ice extent (see the essay on Sea Ice) have contributed substantially to shifts in primary productivity throughout the Arctic Ocean. One of the most recently published studies investigating trends in Arctic Ocean primary productivity showed that annual net primary productivity across the Arctic Ocean increased ~30% during the period 1998-2012, particularly on interior shelves near the shelfbreak (and to a lesser extent on inflow shelves), where sea ice declines are also accompanied by the presence of upwelled nutrients that are sufficient to support production (Arrigo and van Dijken 2015; Falk-Petersen et al. 2015). In contrast, outflow shelves showed either no change or a significant decline in primary production over the same time period, possibly because nutrients had already been consumed upstream of these regions (Arrigo and van Dijken 2015). However, a recent review indicates that the response of outflow shelves to a changing climate is likely more complex than previously thought, with notable spatial heterogeneity (Michel et al. 2015). Declines in sea ice can also have localized negative effects on primary production through freshening and stratification. This occurrence has been particularly strong in the Canada Basin, where sea ice melt since the 1990s has caused a deepening of the nitracline and establishment of a subsurface chlorophyll maximum where light conditions are not ideal for production (Coupel et al. 2015). In the central Arctic Ocean, where primary productivity is relatively low, sea ice algae can contribute up to 60% of total primary production (owing primarily to low pelagic primary productivity) and have recently been found to be principally limited by nitrate off the slope from the Laptev Sea and silicate at the ice margin near the Atlantic inflow (Fernández-Méndez et al. 2015). Important remaining questions include whether the production of sea ice algae in the central Arctic Ocean has increased over recent years owing to thinning ice and/or if nutrients are sufficient to sustain an increase in phytoplankton concentration with overall sea ice retreat (e.g., Fernández-Méndez et al. 2015). However, it is clear that the response of primary production to sea ice loss is likely both seasonally and spatially dependent (e.g., Tremblay et al. 2015).
Chlorophyll-a
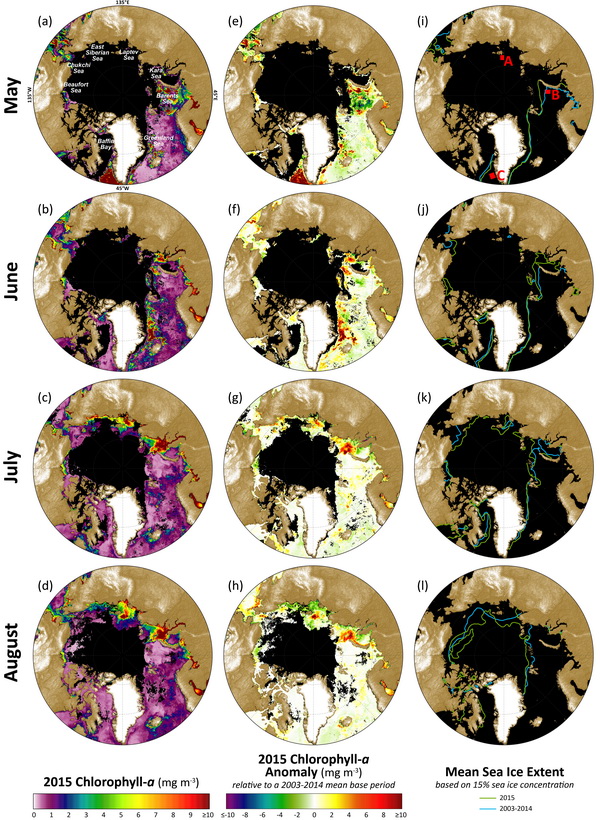
Here we present the complete, updated MODIS-Aqua satellite chlorophyll-a record for 2003-2015. The 2015 data show anomalously high chlorophyll-a concentrations in a number of locations across the Arctic Ocean region, where patterns are spatially and temporally heterogeneous (Fig. 6.1). A base period of 2003-2014 was chosen when calculating the 2015 anomalies to maximize the length of the short satellite-based time series. During May 2015, anomalously high concentrations of chlorophyll-a occurred along the shelf-break in the Bering Sea (Figs. 6.1a and 6.11e), which is associated with earlier breakup of sea ice in that region (Fig. 6.1i). This earlier spring phytoplankton bloom in the Bering Sea and earlier breakup of sea ice are a shift away from recent trends of increasing sea ice cover starting in the early 2000s, primarily during winter (January, February, and March) and spring (April and May) (Frey et al. 2015). The high chlorophyll-a anomalies in southeast Greenland in June (Fig. 6.1f) are likely associated with sea ice cover as well. Although a significant retreat of sea ice is not apparent in the Greenland Sea during this period (Fig. 6.1j), a large fraction of the ice cover that is transported out of the Arctic through Fram Strait ends up in the Greenland Sea where it ultimately melts. Anomalously high concentrations of chlorophyll-a during May 2015 are also found along the southwest coast of Greenland in the northeastern Labrador Sea, where concentrations across a broad area (~600 x 700 km) average over ~16 mg m-3 higher than the 2003-2014 mean (Fig. 6.1e). Later in the season, anomalously high concentrations emerge mainly in the Kara and Laptev seas during July and August (Figs 6.1g and 6.1h), particularly northeast of Novaya Zemlya and west of the New Siberian Islands.
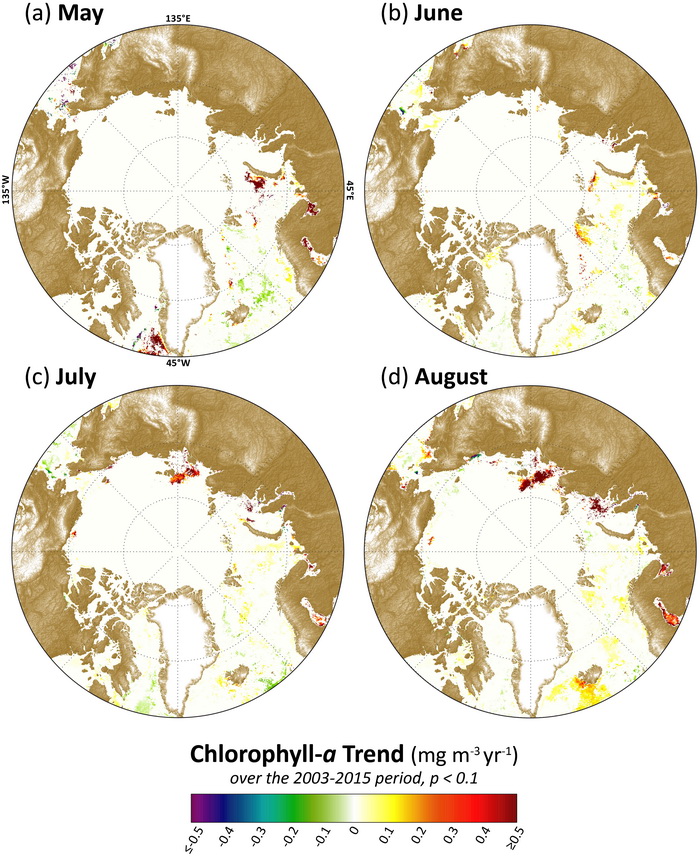
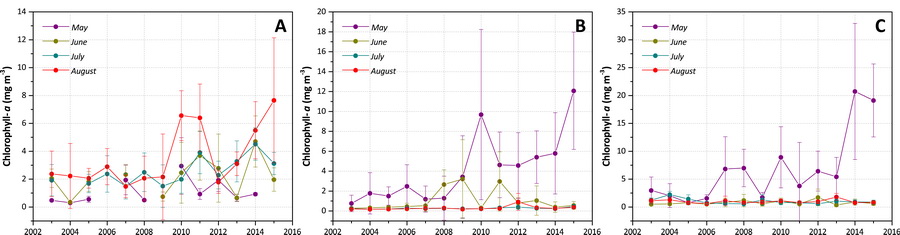
Non-parametric Thiel-Sen median trends indicate the most significant rates of change in the 2003-2015 MODIS-Aqua satellite record in May occur to the southwest of Greenland in the Labrador Sea and to the west of Novaya Zemlya in the Barents Sea (Fig. 6.2a), where the latter is associated with declines in sea ice (Fig. 6.1i) linked to the Atlantic Water inflow (e.g., Alexeev et al. 2013). During July and August 2015, significant increases in chlorophyll-a concentrations are found primarily in the Laptev Sea to the west of the New Siberian Islands (Figs. 6.2c and 6.2d), consistent with the steepest trends identified by Petrenko et al. (2013) utilizing the MODIS-Aqua and SeaWiFS satellite platforms and also linked to declining sea ice cover (Figs. 6.1k and 6.1l). To illustrate the quantitative nature of these trends, three example “hotspot” regions with notably steep trends in chlorophyll-a for May, June, July and August 2003-2015 are shown in Fig. 6.3 (the locations are shown in Fig. 6.1i), which include regions in the (A) Laptev Sea northwest of the New Siberian Islands; (B) Barents Sea west of Novaya Zemlya; and (C) Labrador Sea southwest of Greenland. Location A shows significant (p < 0.1) trends during July and August, while locations B and C show significant (p < 0.1) trends during May. Whereas most non-semi-analytical satellite algorithms (as used here) are affected by large concentrations of CDOM (and may result in erroneously high chlorophyll-a concentrations, e.g., Chaves et al. 2015), the sites described above are far enough north that they should not be heavily influenced by Siberian river plumes.
Primary Productivity
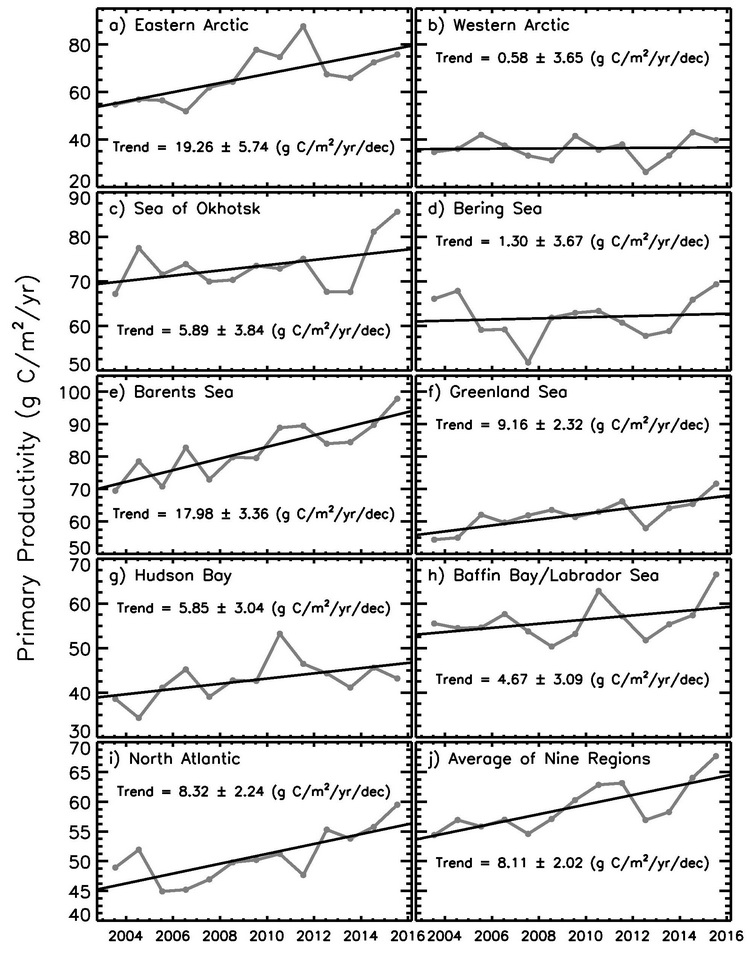
Estimates of ocean primary productivity for nine regions (and the average of these nine regions) across the Arctic show increasing trends during the period 2003-2015 in all regions, as well as positive anomalies for 2015 (Fig. 6.4, Table 4.1). The highest anomalies for 2015 include the Barents Sea (+16.98 g C/m2/yr, or +21.0%), the Sea of Okhotsk (+13.26 g C/m2/yr, or +18.3%), and Baffin Bay/Labrador Sea (+11.20 g C/m2/yr, or +20.2%), while the lowest anomalies include Hudson Bay (+0.31 g C/m2/yr, or +0.7%) and the western (North American) Arctic (+3.69 g C/m2/yr, or +10.2%) (Table 6.1). Statistically significant trends between 2003 and 2015 occur in the eastern (Eurasian) Arctic, Barents Sea, Greenland Sea, Hudson Bay and North Atlantic, with the steepest trends in the eastern Arctic (19.26 g C/m2/yr/dec, or a 41.9% increase) and the Barents Sea (17.98 g C/m2/yr/dec, or a 30.2% increase). There are no statistically significant trends for the western Arctic, Sea of Okhotsk, Bering Sea, Hudson Bay or Baffin Bay/Labrador Sea.
Similar trends (except for the North Atlantic) have been reported previously for these regions using both SeaWiFS and MODIS data (Comiso 2015). However, satellite evidence suggests that recent increases in cloudiness have dampened the increases in productivity that would have otherwise occurred as a function of sea ice decline alone (Bélanger et al. 2013). Further challenges remain with linking primary productivity rates as well as depth-integrated chlorophyll biomass throughout the water column to satellite-based surface chlorophyll-a values (Tremblay et al. 2015). Satellite-based chlorophyll-a and primary productivity estimates are additionally confounded by issues such as river turbidity in coastal regions (e.g., Demidov et al. 2014, Chaves et al. 2015). Efforts to improve satellite retrieval algorithms based on in situ observations are thus critical to continue in all regions of the Arctic.
| Region | Trend, 2003-2015 (g C/m2/yr/dec) |
Mann-Kendall p-value |
% Change | 2015 Anomaly (g C/m2/yr) from a 2003-2014 base period |
2015 Anomaly (%) from a 2003-2014 base period |
|---|---|---|---|---|---|
| Eastern Arctic | 19.26 | 0.007 | 41.9 | 9.78 | 14.8 |
| Western Arctic | 0.58 | 0.765 | 1.9 | 3.69 | 10.2 |
| Sea of Okhotsk | 5.89 | 0.367 | 10.1 | 13.26 | 18.3 |
| Bering Sea | 1.30 | 0.858 | 2.6 | 8.06 | 13.2 |
| Barents Sea | 17.98 | 0.000 | 30.2 | 16.98 | 21.0 |
| Greenland Sea | 9.16 | 0.003 | 19.5 | 10.45 | 17.1 |
| Hudson Bay | 5.85 | 0.057 | 17.8 | 0.31 | 0.7 |
| Baffin Bay/Labrador Sea | 4.67 | 0.435 | 10.5 | 11.20 | 20.2 |
| North Atlantic | 8.32 | 0.003 | 21.7 | 9.35 | 18.6 |
| Average of Nine Regions | 8.11 | 0.001 | 17.9 | 9.23 | 15.8 |
References
Alexeev, V. A., V. V. Ivanov, R. Kwok, and L. H. Smedsrud, 2013: North Atlantic warming and declining volume of arctic sea ice. The Cryosphere Discuss., 7, 245-265, doi:10.5194/tcd-7-245-2013.
Arrigo, K. R., and G. L. van Dijken, 2015: Continued increases in Arctic Ocean primary production. Progress in Oceanography, 136, 60-70.
Barber, D. G., H. Hop, C. J. Mundy, B. Else, I. A. Dmitrenko, J.-É. Tremblay, J. K. Ehn, P. Assmy, M. Daase, L. M. Candlish, and S. Rysgaard. 2015: Selected physical, biological and biogeochemical implications of a rapidly changing Arctic Marginal Ice Zone. Progress in Oceanography, doi:10.1016/j.pocean.2015.09.003.
Behrenfeld, M. J., and P. G. Falkowski, 1997: Photosynthetic rates derived from satellite-based chlorophyll concentration. Limnology and Oceanography, 42(1), 1-20.
Bélanger, S., M. Babin, and J. É. Tremblay, 2013: Increasing cloudiness in Arctic damps the increase in phytoplankton primary production due to sea ice receding. Biogeosci., 10, 4087-4101, doi:10.5194/bg-10-4087-2013.
Cavalieri, D. J., C. L. Parkinson, P. Gloersen, and H. Zwally, 1996, updated yearly: Sea Ice Concentrations from Nimbus-7 SMMR and DMSP SSM/I-SSMIS Passive Microwave Data. [2003-2014]. Boulder, Colorado USA: NASA DAAC at the National Snow and Ice Data Center.
Chaves, J., P. J. Werdell, C. W. Proctor, A. R. Neeley, S. A. Freeman, C. S. Thomas, and S. B. Hooker, 2015: Assessment of ocean color data records from MODIS-Aqua in the western Arctic Ocean. Deep-Sea Research II, 118, Part A, 32-43, doi:10.1016/j.dsr2.2015.02.011.
Comiso, J. C., 2015: Variability and trends of the Global Sea Ice Covers and Sea Levels: Effects on Physicochemical Parameters. Climate and Fresh Water Toxins, Luis M. Botana, M. Carmen Lauzao and Natalia Vilarino, Eds., De Gruyter, Berlin, Germany.
Coupel, P., D. Ruiz-Pino, M. A. Sicre, J. F. Chen, S. H. Lee, N. Schiffrine, H. L. Li, and J. C. Gascard, 2015: The impact of freshening on phytoplankton production in the Pacific Arctic Ocean. Progress in Oceanography, 131, 113-125.
Demidov, A. B., S. A. Mosharov, and P. N. Makkaveev, 2014: Patterns of the Kara Sea primary production in autumn: Biotic and abiotic forcing of subsurface layer. J. Marine Systems, 132, 130-149, doi:10.1016/j.jmarsys.2014.01.014.
Falk-Petersen, S., V. Pavlov, J. Berge, F. Cottier, K. M. Kovacs, and C. Lydersen, 2015: At the rainbow’s end: high productivity fueled by upwelling along an Arctic shelf. Polar Biol., 38, 5-11, doi:10.1007/s00300-014-1482-1.
Fernandez-Mendez, M., C. Katlein, B. Rabe, M. Nicolaus, I. Peeken, K. Bakker, H. Flores, and A. Boetius, 2015: Photosynthetic production in the central Arctic Ocean during the record sea-ice minimum in 2012. Biogeosci., 12, 3525-3549.
Frey, K. E., G. W. K. Moore, J. M. Grebmeier, and L. W. Cooper, 2015: Divergent Patterns of Recent Sea Ice Cover across the Bering, Chukchi, and Beaufort Seas of the Pacific Arctic Region. Progress in Oceanography, 136, 32-49, http://dx.doi.org/10.1016/j.pocean.2015.05.009.
Hill, V. J., P. A. Matrai, E. Olson, S. Suttles, M. Steele, L. A. Codispoti, and R. C. Zimmerman, 2013: Synthesis of integrated primary production in the Arctic Ocean: II. In situ and remotely sensed estimates. Progress in Oceanography, 110, 107-125, doi:10.1016/j.pocean.2012.11.005.
Leu, E., C. J. Mundy, P. Assmy, K. Campbell, T. M. Gabrielsen, M. Gosselin, T. Juul-Pedersen, and R. Gradinger, 2015: Arctic spring awakening – Steering principles behind the phenology of vernal ice algal blooms. Progress in Oceanography, http://dx.doi.org/10.1016/j.pocean.2015.07.012.
Maslanik, J., and J. Stroeve, 1999, updated daily: Near-Real-Time DMSP SSM/I-SSMIS Daily Polar Gridded Sea Ice Concentrations. [2015]. Boulder, Colorado USA: NASA DAAC at the National Snow and Ice Data Center.
Michel, C., J. Hamilton, E. Hansen, D. Barber, M. Reigstad, J. Iacozza, L. Seuthe, and A. Niemi, 2015: Arctic Ocean outflow shelves in the changing Arctic: A review and perspectives. Progress in Oceanography, doi:10.1016/j.pocean.2015.08.007.
Müller-Karger, F. E., R. Varela, R. Thunell, R. Luerssen, C. Hu, and J. J. Walsh, 2005: The importance of continental margins in the global carbon cycle. Geophys. Res. Lett., 32, L01602, doi:10.1029/2004GL021346.
Petrenko, D., D. Pozdnyakov, J. Johannessen, F. Counillon, and V. Sychov, 2013: Satellite-derived multi-year trend in primary production in the Arctic Ocean. Int. J. Remote Sens., 34, 3903-3937, http://dx.doi.org/10.1080/01431161.2012.762698.
Tremblay J.-É., L. G. Anderson, P. Matrai, S. Bélanger, C. Michel, P. Coupel, and M. Reigstad, 2015: Global and regional drivers of nutrient supply, primary production and CO2 drawdown in the changing Arctic Ocean. Progress in Oceanography, doi:10.1016/j.pocean.2015.08.009.
November 25, 2015