
K. E. Frey1, J. C. Comiso2, L. W. Cooper3, J. M. Grebmeier3, and L. V. Stock2
1Graduate School of Geography, Clark University, Worcester, MA, USA
2Cryospheric Sciences Laboratory, Goddard Space Flight Center, NASA, Greenbelt, MD, USA
3Chesapeake Biological Laboratory, University of Maryland Center for Environmental Science, Solomons, MD, USA
(See erratum, published in 2021)
Highlights
- Satellite estimates of ocean primary productivity (i.e., the rate at which marine algae transform dissolved inorganic carbon into organic material) showed higher values for 2019 (relative to the 2003-18 mean) for seven of the nine investigated regions (with the Barents Sea and North Atlantic the only regions showing lower than average values).
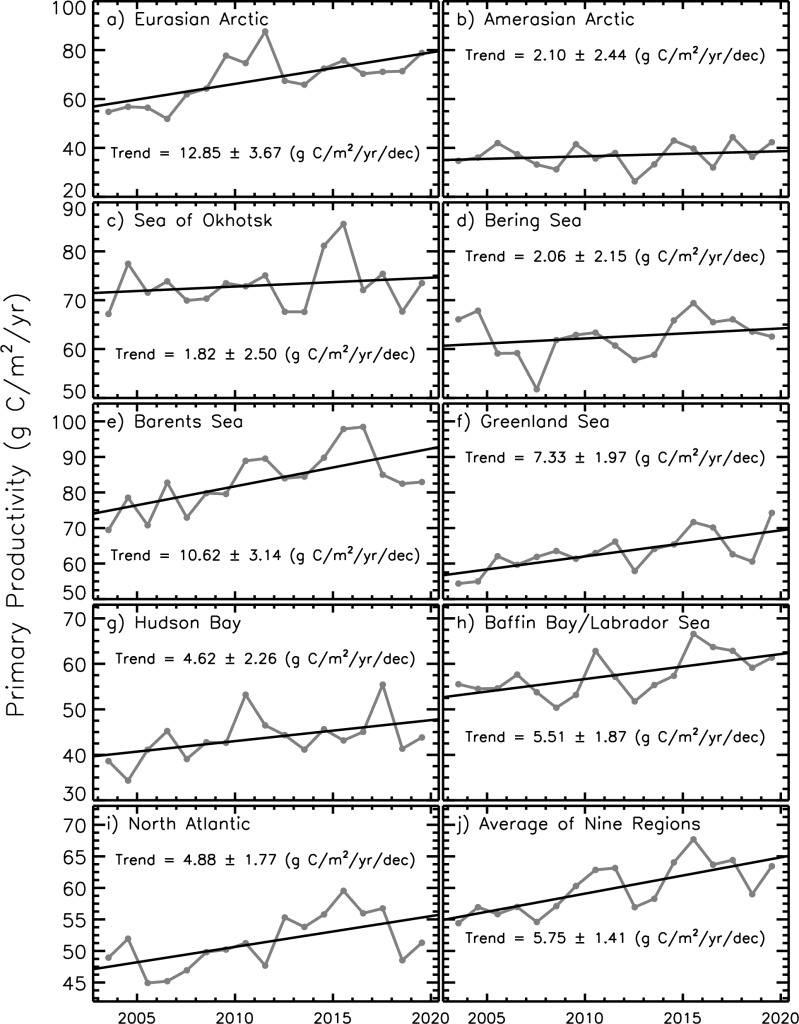
- All regions continue to exhibit positive trends over the 2003-19 period, with the strongest trends in the Eurasian Arctic, Barents Sea, and Greenland Sea.
- During May 2019, a ~1500 km long region along the sea ice edge in the Greenland Sea showed on average ~18 times higher chlorophyll-a concentrations than the same month of the previous years (2003-18) on record.
- Unprecedented declines of sea ice in the Bering Sea in late winter 2018 and 2019 have been associated with shifts in the timing and intensity of phytoplankton blooms. Both years showed increases in chlorophyll biomass in March in the St. Lawrence Island Polynya region, associated with earlier spring break-up of sea ice. However, 2019 (unlike 2018) showed a more characteristic phytoplankton bloom in May, which may be associated with the resurgence of ice cover in April 2019.
Introduction
Autotrophic single-celled algae living in sea ice (ice algae) and water column (phytoplankton) are the main primary producers in the Arctic Ocean. Through photosynthesis, they transform dissolved inorganic carbon into organic material. Consequently, primary production provides a key ecosystem service by providing energy to the entire food web in the oceans. Primary productivity is strongly dependent upon light availability and the presence of nutrients, and thus is highly seasonal in the Arctic. In particular, the melting and retreat of sea ice during spring are strong drivers of primary production in the Arctic Ocean and its adjacent shelf seas, owing to enhanced light availability and stratification (Barber et al. 2015; Leu et al. 2015; Ardyna et al. 2017). Recent declines in Arctic sea ice extent (see essay Sea Ice) have contributed substantially to shifts in primary productivity throughout the Arctic Ocean. However, the response of primary production to sea ice loss has been both seasonally and spatially variable (e.g., Tremblay et al. 2015; Hill et al. 2018).
Here we present satellite-based estimates of algal chlorophyll-a (occurring in all species of phytoplankton), based on the color of the ocean, and subsequently provide calculated primary production estimates. These results are shown for ocean areas with less than 15% sea ice concentration and, therefore, do not include production by sea ice algae or under-ice phytoplankton blooms.
Chlorophyll-a
Measurements of the algal pigment chlorophyll (e.g., chlorophyll-a) serve as a proxy for the amount of algal biomass present as well as overall plant health. The complete, updated MODIS-Aqua satellite chlorophyll-a record for the northern polar region for the years 2003-19 can serve as a time series against which individual years can be compared. For this reporting, a reference period of 2003-18 was chosen to calculate the 2019 anomalies to maximize the length of the satellite-based time series.
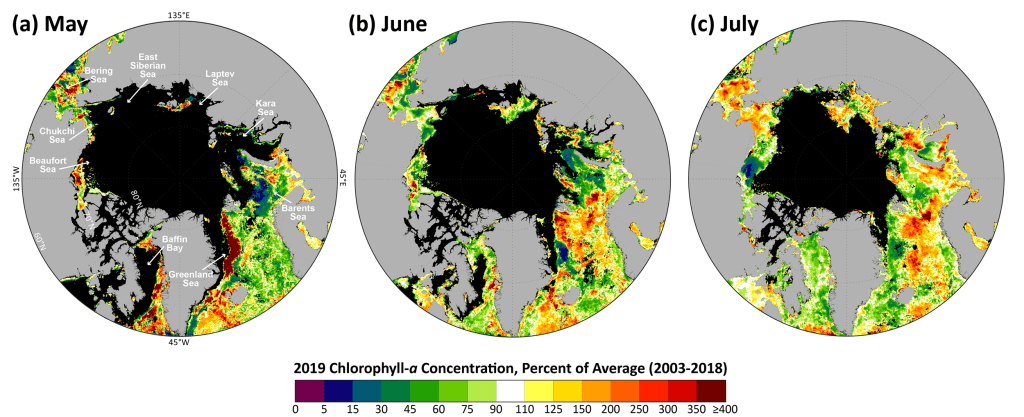
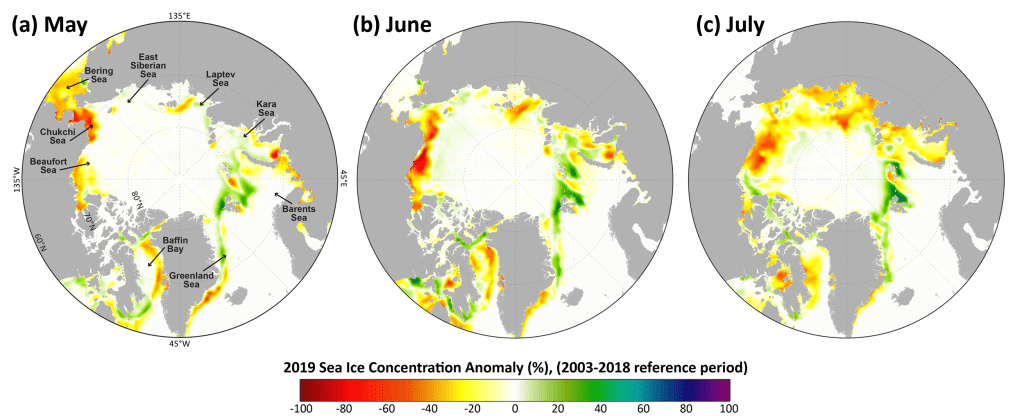
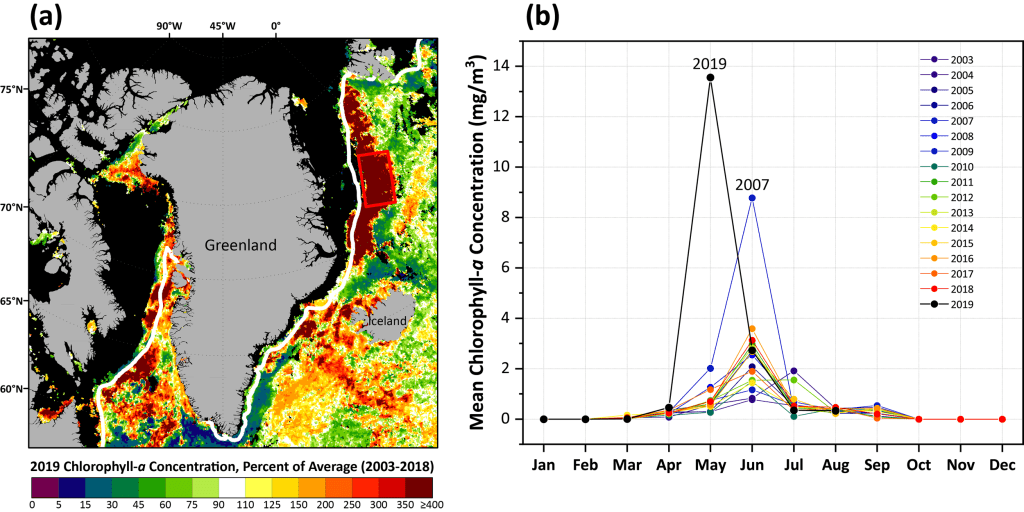
The 2019 data show a distribution of both positive and negative anomalies in chlorophyll-a concentrations in a number of locations across the Arctic Ocean region, where patterns are spatially and temporally heterogeneous (Fig. 1). These patterns are often associated with the timing of the seasonal break-up and retreat of the sea ice cover (Fig. 2): positive anomalies tend to occur in regions where the break-up is relatively early, while negative anomalies tend to occur in regions where the break-up is delayed. The most notable positive anomalies in 2019 occurred during May, with high concentrations of chlorophyll-a occurring along the ice edge in the Greenland Sea (Figs. 1a and 3). In particular, this regional positive anomaly of chlorophyll-a concentrations extended nearly 1500 km in length from Svalbard at ~80° N southward to central East Greenland at 70° N and exhibited on average ~18 times higher concentrations than previous years on record (Fig. 3b). Before this observed anomaly, the highest concentration in chlorophyll-a for this region had been in June 2007 (Fig. 3b), but it was only two-thirds as high as in 2019. Furthermore, not only was the intensity of the spring bloom unprecedented in 2019, but also the timing: peak seasonal phytoplankton blooms in this region typically occur in June (Fig. 3b) but were shifted one month earlier to May in 2019. Additional widespread positive anomalies occurred in the Bering Sea in May, June, and July, which are discussed in greater detail below. Some of the strongest negative anomalies in chlorophyll-a concentrations (i.e., low primary productivity) occurred in the Barents Sea in May (Fig. 1a) and in the Beaufort Sea in July (Fig. 1c). The relatively low chlorophyll-a concentrations in the Barents Sea in May are associated with increases in sea ice cover in that region throughout the season (Fig. 2a-c).
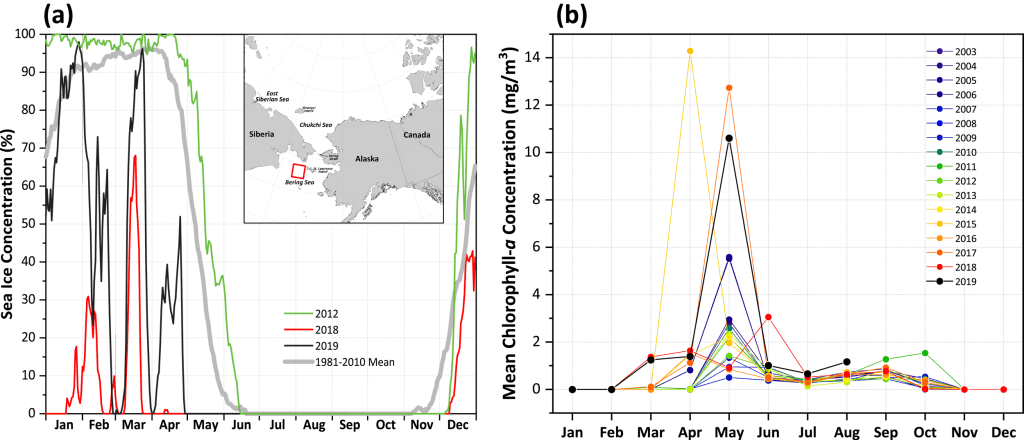
As noted above, some of the largest positive anomalies in chlorophyll-a concentrations observed in 2019 occurred over the shelf region of the Bering Sea during May and June (Fig. 1a,b). During July, these positive anomalies extended more widely across the northern Bering Sea and into the Chukchi Sea (Fig. 1c). In particular, focusing on the Distributed Biological Observatory Site 1 (DBO1; Moore and Grebmeier 2018) in the St. Lawrence Island Polynya (SLIP) region, 2019 experienced similar declines in sea ice that also occurred in 2018 (Frey et al. 2018; Stabeno and Bell 2019) (Fig. 4a). However, while sea ice had disappeared from this region by the end of March in both 2018 and 2019, 2019 in contrast showed a slight resurgence of ice during the month of April before it declined again a few weeks later by the end of April. These general patterns of early sea ice break-up at DBO1 are associated with upticks in March chlorophyll-a concentrations that were observed in both 2018 and 2019 (Fig. 4b). In 2018, it was apparent that the typical large blooms that are produced in April and May did not occur; instead, we observed a redistribution of chlorophyll biomass in March (~275% increase over the 2003-17 average) and June (~500% increase over the 2003-17 average) (Frey et al. 2018). In contrast, the typical seasonal bloom of phytoplankton occurred as expected in May 2019 (Fig. 4b), which may be associated with the resurgence of sea ice cover in the region in April. In particular, May 2019 showed a ~360% increase in chlorophyll-a concentrations over the 2003-18 average, with similar percentage increases persisting through the season including ~140% (June), ~200% (July), and ~220% (August) (Fig. 4b).
Having knowledge of how regions experience changes in chlorophyll-a concentrations alongside dramatic losses of sea ice cover provides insight into what to expect with future sea ice declines. While many of these observed patterns are directly linked to sea ice variability (and therefore light availability), it is important to note that there are other dominant factors at play that add to the complexity of observed chlorophyll-a concentrations such as the distribution and availability of nutrients (e.g., Giesbrecht et al. 2019). The impacts of sea ice decline on specific water column phytoplankton properties, such as community composition and carbon biomass (Neeley et al. 2018), as well as broader ecosystem responses (Duffy-Anderson et al. 2019), are critical to continue to monitor.
Primary production
Chlorophyll-a concentrations give an estimate of the total standing stock of algal biomass. However, rates of primary production (i.e., the production of organic carbon via photosynthesis) provide a different perspective since not all algae present in the water column are necessarily actively producing, and can be estimated by combining remotely sensed chlorophyll-a concentrations with sea surface temperatures, incident solar irradiance, and mixed layer depths (see Fig. 5 for references to details of the method for estimation). Estimates of ocean primary productivity for nine regions (and the average of these nine regions) across the Arctic, relative to the 2003-18 reference period, indicate above-average primary productivity for 2019 in all regions except for the Barents Sea and North Atlantic (Fig. 5, Table 1). In the longer term, positive trends in primary productivity occurred in all regions during the period 2003-19 (Fig. 5, Table 1). Statistically significant positive trends occurred in the Eurasian Arctic, Barents Sea, Greenland Sea, Baffin Bay/Labrador Sea, North Atlantic, and for the average of the nine regions. The steepest trends were found for the Eurasian Arctic (12.85 g C/m2/yr/dec, or a ~35.5% increase), the Barents Sea (10.62 g C/m2/yr/dec, or a ~22.7% increase), and the Greenland Sea (7.33 g C/m2/yr/dec, or a ~20.5% increase).
| Region | Trend, 2003-19 (g C/m2/yr/decade) |
Mann-Kendall p-value |
% Change | 2019 Anomaly (g C/m2/yr) from a 2003-18 base period |
2019 Primary Productivity (% of the 2003-18 average) |
| Eurasian Arctic | 12.85 | 0.003 | 35.5 | 11.32 | 116.8 |
| Amerasian Arctic | 2.10 | 0.349 | 9.5 | 5.78 | 115.8 |
| Sea of Okhotsk | 1.82 | 0.490 | 4.1 | 0.44 | 100.6 |
| Bering Sea | 2.06 | 0.490 | 5.4 | 0.07 | 100.1 |
| Barents Sea | 10.62 | 0.002 | 22.7 | -0.45 | 99.5 |
| Greenland Sea | 7.33 | 0.005 | 20.5 | 11.80 | 118.9 |
| Hudson Bay | 4.62 | 0.052 | 18.5 | 0.09 | 100.2 |
| Baffin Bay/Labrador | 5.51 | 0.042 | 16.6 | 4.11 | 107.2 |
| North Atlantic | 4.88 | 0.006 | 16.5 | -0.11 | 99.8 |
| Average of nine regions | 5.75 | 0.000 | 16.6 | 3.67 | 106.1 |
References
Ardyna, M., M. Babin, E. Devred, A. Forest, M. Gosselin, P. Raimbault, and J. -É. Tremblay, 2017: Shelf-basin gradients shape ecological phytoplankton niches and community composition in the coastal Arctic Ocean (Beaufort Sea). Limnol. Oceanogr., 62, 2113-2132, https://doi.org/10.1002/lno.10554.
Barber, D. G., H. Hop, C. J. Mundy, B. Else, I. A. Dmitrenko, J. -É. Tremblay, J. K. Ehn, P. Assmy, M. Daase, L. M. Candlish, and S. Rysgaard, 2015: Selected physical, biological and biogeochemical implications of a rapidly changing Arctic Marginal Ice Zone. Prog. Oceanogr., 139, 122-150, https://doi.org/10.1016/j.pocean.2015.09.003.
Behrenfeld, M. J., and P. G. Falkowski, 1997: Photosynthetic rates derived from satellite-based chlorophyll concentration. Limnol. Oceanogr., 42(1), 1-20.
Comiso, J. C., 2015: Variability and trends of the global sea ice covers and sea levels: Effects on physicochemical parameters. Climate and Fresh Water Toxins, L. M. Botana, M. Carmen Lauzao, and N. Vilarino, Eds., De Gruyter, Berlin, Germany.
Comiso, J. C., R. Gersten, L. Stock, J. Turner, G. Perez, and K. Cho, 2017a: Positive trends in the Antarctic sea ice cover and associated changes in surface temperature. J. Climate, 30, 2251-2267, https://doi.org/10.1175/JCLI-D-0408.1.
Comiso, J. C., W. N. Meier, and R. Gersten, 2017b: Variability and trends in the Arctic Sea ice cover: Results from different techniques. J. Geophys. Res. Oceans, 122, 6883-6900, https://doi.org/10.1002/2017JC012768.
Duffy-Anderson, J. T., P. Stabeno, A. G. Andrews III, K. Cieciel, A. Dreary, E. Farley, C. Fugate, C. Harpold, R. Heintz, D. Kimmel, K. Kuletz, J. Lamb, M. Paquin, S. Porter, L. Rogers, A. Spear, and E. Yasumiishi, 2019: Responses of the northern Bering Sea and southeastern Bering Sea pelagic ecosystems following record-breaking low winter sea ice. Geophys. Res. Lett., 46(16), 9833-9842, https://doi.org/10.1029/2019GL083396.
Frey, K. E., J. C. Comiso, L. W. Cooper, J. M. Grebmeier, and L. V. Stock, 2018: Arctic Ocean primary productivity: The response of marine algae to climate warming and sea ice decline. Arctic Report Card 2018, E. Osborne, J. Richter-Menge, and M. Jeffries, Eds., https://www.arctic.noaa.gov/Report-Card.
Giesbrecht, K. E., D. E. Varela, J. Wiktor, J. M. Grebmeier, B. Kelly, and J. E. Long, 2019: A decade of summertime measurements of phytoplankton biomass, productivity and assemblage composition in the Pacific Arctic Region from 2006 to 2016. Deep-Sea Res. Pt. II, 162, 93-113, https://doi.org/10.1016/j.dsr2.2018.06.010.
Hill, V., M. Ardyna, S. H. Lee, and D. E. Varela, 2018: Decadal trends in phytoplankton production in the Pacific Arctic Region from 1950 to 2012. Deep-Sea Res. Pt. II, 152, 82-94, https://doi.org/10.1016/j.dsr2.2016.12.015.
Leu, E., C. J. Mundy, P. Assmy, K. Campbell, T. M. Gabrielsen, M. Gosselin, T. Juul-Pedersen, and R. Gradinger, 2015: Arctic spring awakening – Steering principles behind the phenology of vernal ice algal blooms. Prog. Oceanogr., 139, 151-170, https://doi.org/10.1016/j.pocean.2015.07.012.
Moore, S. E., and J. M. Grebmeier, 2018: The distributed biological observatory: Linking physics to biology in the Pacific Arctic region. Arctic, 71(Suppl. 1), 1-7, https://doi.org/10.14430/arctic4606.
Neeley, A. R., L. A. Harris, and K. E. Frey, 2018: Unraveling phytoplankton community dynamics in the northern Chukchi and western Beaufort seas amid climate change. Geophys. Res. Lett., 45(15), 7663-7671, https://doi.org/10.1029/2018GL077684.
Stabeno, P., and S. W. Bell, 2019: Extreme conditions in the Bering Sea (2017-2018): Record-breaking low sea-ice extent. Geophys. Res. Lett., 46, 8952-8959, https://doi.org/10.1029/2019GL083816.
Tremblay J. -É., L. G. Anderson, P. Matrai, S. Bélanger, C. Michel, P. Coupel, and M. Reigstad, 2015: Global and regional drivers of nutrient supply, primary production and CO2 drawdown in the changing Arctic Ocean. Prog. Oceanogr., 139, 171-196, https://doi.org/10.1016/j.pocean.2015.08.009.
November 20, 2019