
D. Perovich1, W. Meier2, M. Tschudi3, S. Farrell4, S. Hendricks5, S. Gerland6, L. Kaleschke5, R. Ricker5, X. Tian-Kunze5, M. Webster7, and K. Wood8,9
1Thayer School of Engineering, Dartmouth College, Hanover, NH, USA
2National Snow and Ice Data Center, Cooperative Institute for Research in Environment Sciences at the University of Colorado, Boulder, CO, USA
3Aerospace Engineering Sciences, University of Colorado, Boulder, CO, USA
4NOAA Earth System Science Interdisciplinary Center, University of Maryland, College Park, MD, USA
5Alfred Wegener Institute, Helmholtz Centre for Polar and Marine Research, Bremerhaven, Germany
6Norwegian Polar Institute, Fram Centre, Tromsø, Norway
7Geophysical Institute, University of Alaska Fairbanks, Fairbanks, AK, USA
8Joint Institute for the Study of the Atmosphere and Ocean, University of Washington, Seattle, WA, USA
9Pacific Marine Environmental Laboratory, NOAA, Seattle, WA, USA
Highlights
- The Arctic sea ice cover continues the declining trends in the summer minimum and winter maximum extents. In 2019, the end of summer extent was tied with 2007 and 2016 as the 2nd lowest and the end of winter extent was the 7th lowest in the satellite record (1979-2019).
- As in the previous year (2017/18), the Bering Sea had little ice during most of the 2018/19 winter and 2019 spring seasons.
- The Chukchi Sea experienced very early melt onset and rapid ice loss in spring 2019, and by the end of summer 2019 reached one of the lowest ice extents in the satellite record for the region.
- Despite low extents, sea ice volume was higher over much of the central Arctic compared to the average since Cryosat-2 measurements began in 2011.
Sea ice extent
Sea ice is an important element of the Arctic system because it (1) acts as a barrier between the underlying ocean and the atmosphere, (2) limits the amount of absorbed solar energy during the summer due to its high albedo, (3) provides a habitat for biological activity, (4) limits human access to the Arctic Ocean, and (5) serves as a platform for Indigenous community hunting and travel. Arctic sea ice cover varies substantially during the year, with end-of-winter ice cover generally being two to three times as large as at the end of summer. Sea ice extent has been continuously monitored by passive microwave instruments on satellite platforms since 1979, providing a consistent long-term perspective on changing coverage over the last four decades.
The sea ice extent estimates used here are based on products from the National Snow and Ice Data Center (NSIDC) Sea Ice Index (Fetterer et al. 2017), derived from NASA gridded sea ice concentration fields (Cavalieri et al. 1996; Maslanik and Stroeve 1999). Other similar products exist and, while absolute numbers vary, they all show general consistency in trends and variability.
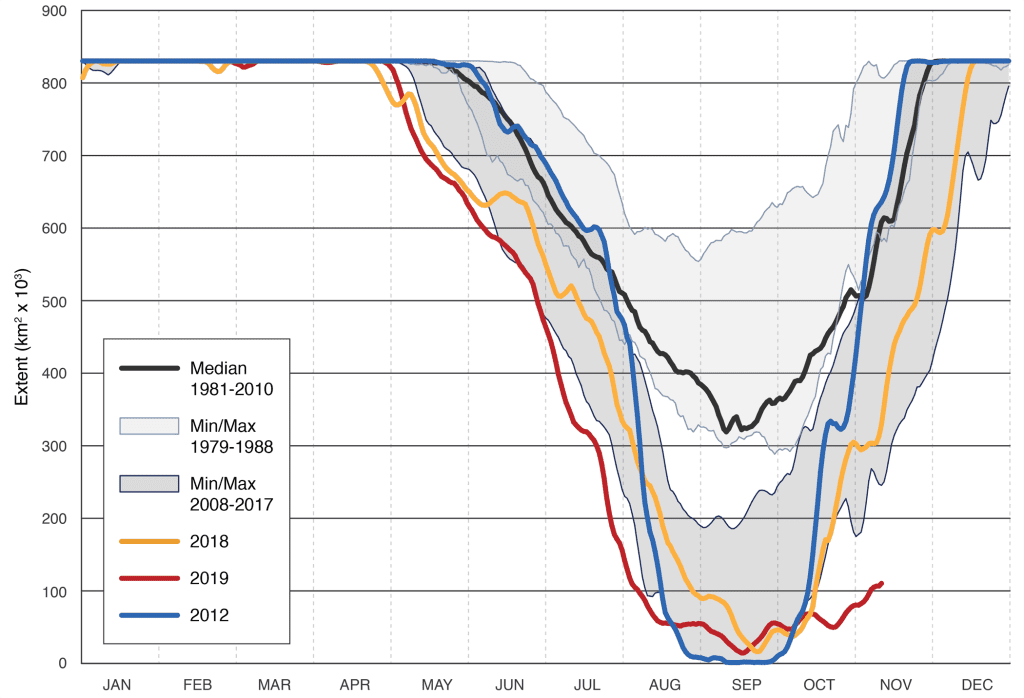
The months of March and September are of particular interest in sea ice time series because they represent typical Arctic sea ice maximum and minimum extents, respectively. Figure 1 shows monthly average ice extents in March and September 2019. The sea ice cover reached a winter maximum extent of 14.78 million km2 on 13 March 2019. This was tied with 2007 as the 7th lowest maximum extent in the 41-year satellite record and was 5.9% below the 1981-2010 average. The previous four years (2015-18) are the four lowest years in the record. However, these losses are not evenly distributed, with some marginal seas near normal, such as the Sea of Okhotsk for example, while the Bering Sea was 70-80% lower than normal.
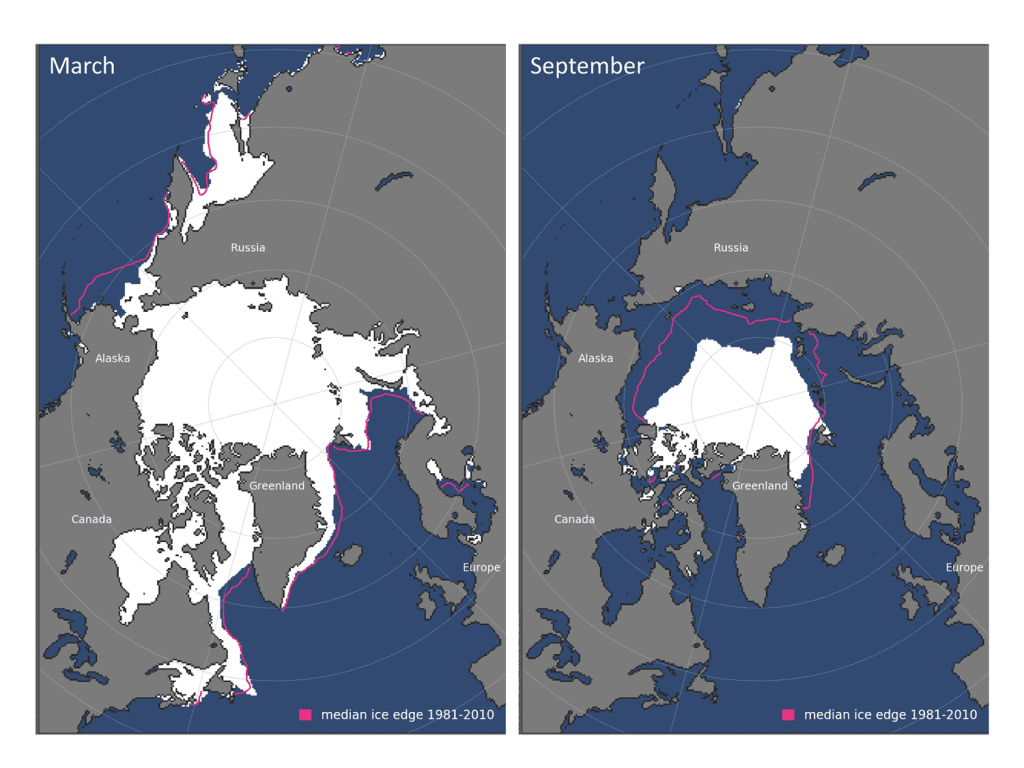
The sea ice cover reached a minimum summer extent of 4.15 million km2 on 18 September 2019. This was tied with 2007 and 2016 as the 2nd lowest extent of the satellite record and was 2.04 million km2 (33%) less than the 1981-2010 average minimum ice extent. The September ice extent has not returned to pre-2007 levels; the 13 lowest extents in the satellite record having all occurred in the last 13 years (2007-19).
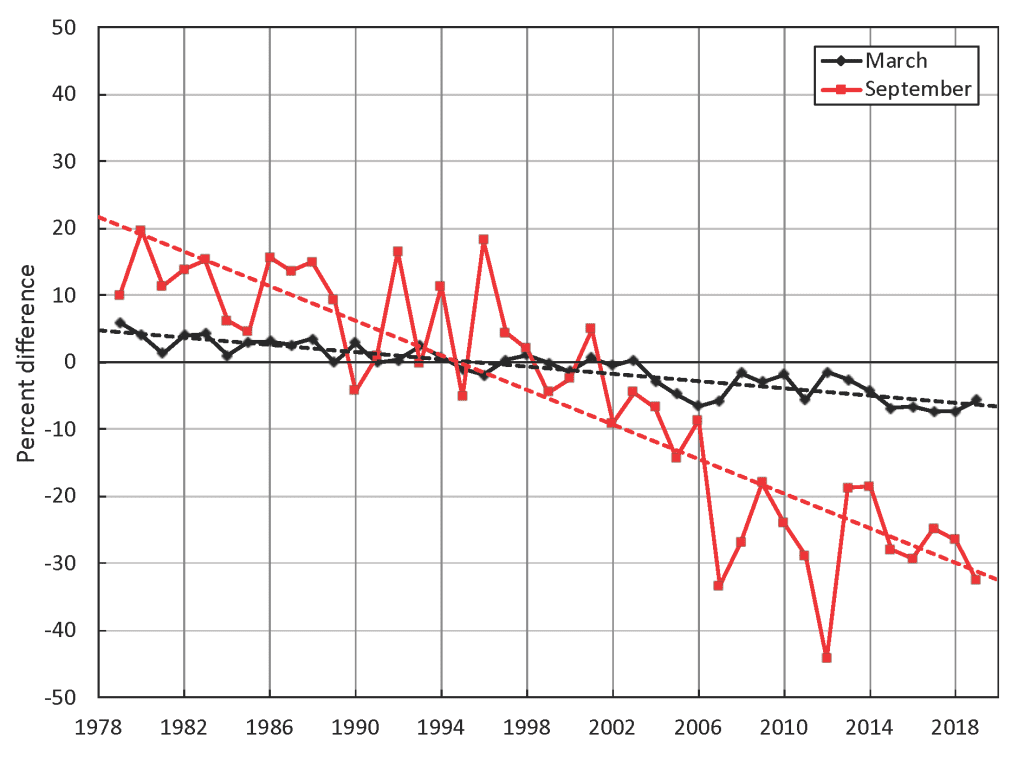
Observations of Arctic sea ice extent have shown decreasing trends in all months and virtually all regions (Meier et al. 2014). The September monthly average trend for the entire Arctic Ocean is now -12.9 ± 2.2% per decade relative to the 1981-2010 average (Fig. 2), statistically significant at the 99% confidence level. Trends are smaller during March (-2.7% per decade), but the decrease is statistically significant. In 2019, 10.63 million km2 of ice was lost between the March maximum and September minimum extent, the fourth greatest difference between maximum and minimum extents in the satellite record.
The 2019 melt season started fairly slowly relative to recent years, with ice extent loss rates near normal despite the lack of winter/spring ice in the Bering Sea (see essay Recent Warming in the Bering Sea for further information about sea ice conditions in the Bering Sea). However, in late June and July the loss rate accelerated considerably such that by mid-July ice extent was below that of mid-July 2012, the year the current record low minimum extent occurred. Starting in mid-August 2019, the loss rate slowed considerably through early September, falling well off the 2012 pace. September had two brief periods of further ice loss in the first half of the month with essentially no change or increasing extent during the rest of the month.
Age of the sea ice
The age of sea ice is also a key descriptor of the state of the sea ice cover. It serves as an indicator for ice physical properties, including snow cover, surface roughness, optical properties, melt pond coverage, salinity, and thickness (Tschudi et al. 2016). Older ice tends to be thicker and thus more resilient to changes in atmospheric and oceanic forcing compared to younger ice. The age of the ice has been determined using satellite observations and drifting buoy records to track ice parcels over several years (Tschudi et al. 2010; Maslanik et al. 2011). This method has been used to provide a record of the age of the ice since the early 1980s (Tschudi et al. 2019 a,b).
The oldest ice (>4 years old), which once dominated within the Arctic Ocean, now makes up just a small fraction of the Arctic Ocean ice pack in March, when the sea ice cover is at its maximum extent (Fig. 3). In 1985, 33% of the ice pack was very old ice (>4 years), but by March 2019 old ice only constituted 1.2% of the ice pack within the Arctic Ocean. The total extent of the oldest ice declined from 2.52 million km2 in March 1985 to 0.09 million km2 in March 2019. Note that previous Arctic Report Cards calculated age percentages based on all ice-covered regions. This year the percentages are relative to ice in the Arctic Ocean region (Fig. 3, bottom inset); areas outside of this region have little or no older ice and thus do not show any change over time.
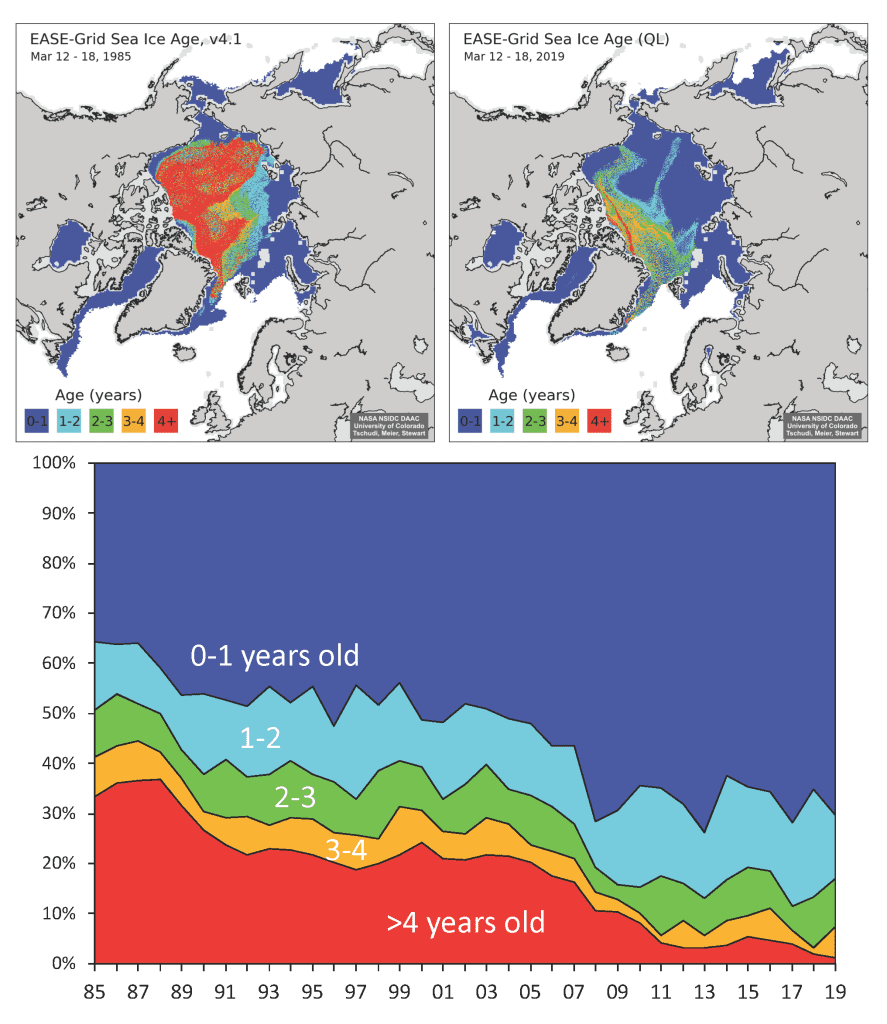
First-year ice now dominates the sea ice cover, comprising ~70% of the March 2019 ice pack, compared to approximately 35-50% in the 1980s. Given that older ice tends to be thicker, the sea ice cover has transformed from a strong, thick ice mass in the 1980s to a younger, more fragile, and thinner ice mass in recent years. First-year ice is therefore more vulnerable to melting out in summer, thereby increasing the likelihood of lower minimum ice extents.
The distribution of ice age in March 2019 was generally similar to that in March of the previous year. The largest changes were a decrease in second-year ice (1-2 years old) coverage, from 21.4% in March 2018 to 12.8% in March 2019, and an increase in 3-4 year old ice from 1.3% to 6.3%. The increase in the 3-4 year old ice results as ice survives the summer melt season and ages. This could replenish the >4 year old ice category, but in recent years, ice has tended to be lost either by melt or be advection out of the Arctic.
Sea ice volume
Satellite remote sensing and airborne survey programs extended the observational data record of Arctic sea ice thickness (SIT) and volume in 2019. The ESA CryoSat-2 radar altimeter and SMOS L-Band radiometer missions have each completed their ninth year of operation. The data from both satellites have been combined in a multi-sensor SIT analysis based on an optimal interpolation scheme (Ricker et al. 2017) and are available on a weekly basis; the analyses cover all sea ice in the Northern Hemisphere during autumn to early spring (mid-October to mid-April). Combined with sea ice concentration, the CryoSat-2/SMOS product evaluates change and variability of sea ice volume (SIV) over the past nine winter seasons.
The weekly SIV time series from November 2010 to April 2019 is shown in the upper panel of Fig. 4. The Northern Hemisphere gained 12,524 km3 of sea ice between October 2018 and April 2019. The gain is essentially the same as the mean volume gain of 12,559 km3 in the CryoSat-2/SMOS data record. The 2018/19 SIV was higher than average for the entire season, indicated by a positive SIV anomaly (lower panel in Fig. 4).
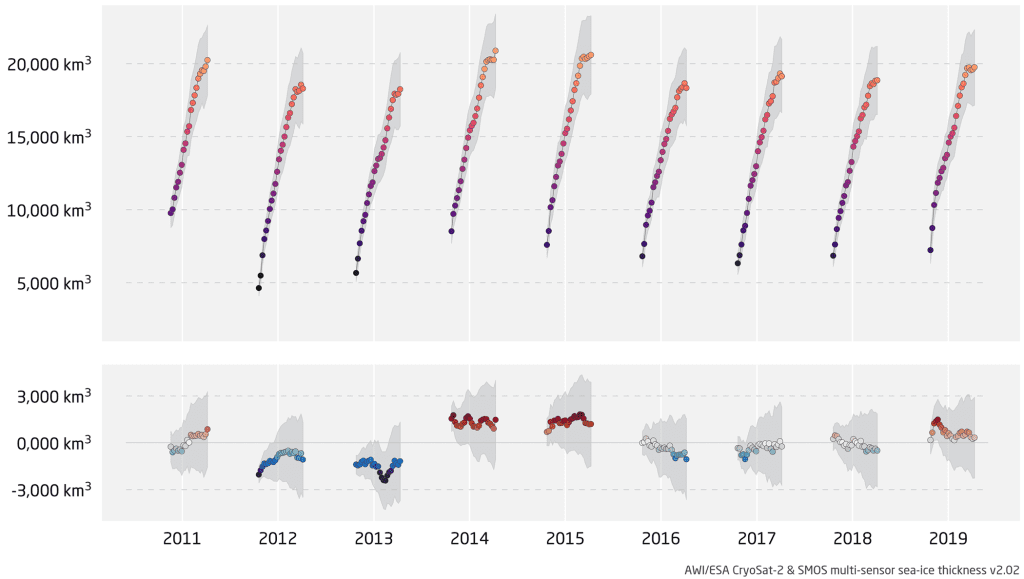
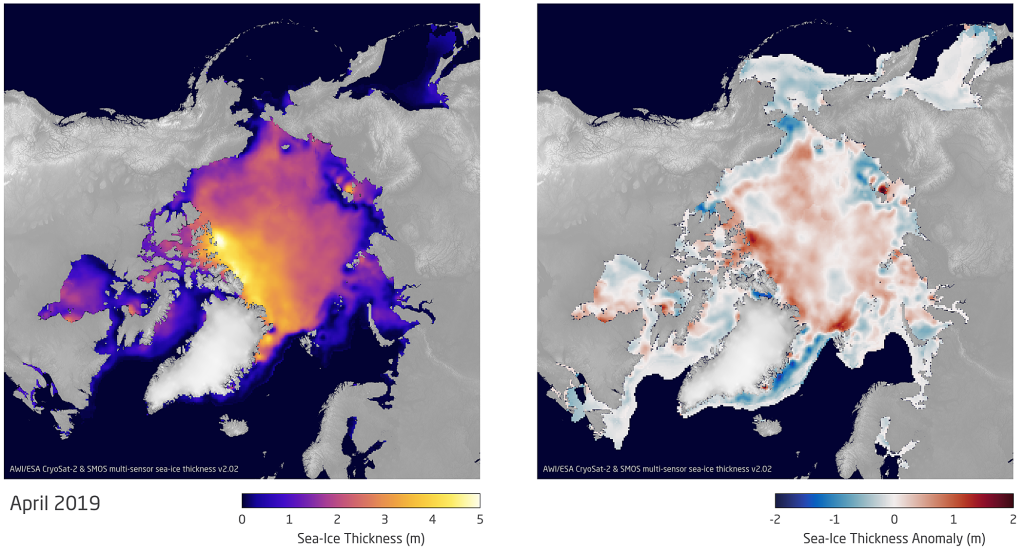
The above-average SIV in the Northern Hemisphere was driven by above-average SIT in the central Arctic Basin, rather than by increased sea ice extent. Figure 5 shows the regional distribution of SIT in mid-April 2019 and its difference from the mean of the previous years. A significant portion of the central Arctic Basin shows a positive thickness anomaly, with a mean SIT of 2.04 m that is 0.09 (+4.6%) above the average SIT of the eight previous winters. Above-average SIT in the central Arctic Basin mitigated the impact of sea ice area loss on SIV in the short observation period of the past 9 winters seasons, notwithstanding the long-term loss of SIV in the Northern Hemisphere (Kwok 2018). The above-average thickness in the central Arctic Basin, however, adds to the resilience of sea ice with respect to summer melt.
Chukchi Sea
The Chukchi Sea has experienced large changes in sea ice coverage. The September 2018 Arctic sea ice minimum extent was characterized by profound sea ice loss in the Chukchi Sea (Fig. 6). The dearth of sea ice continued into the autumn season, accompanied by anomalously warm air temperatures of 3-8°C above the 1981-2010 average. Progressing into October and November 2018, a high-pressure system over the Bering Sea expanded into the Chukchi and Beaufort Seas, sustaining warm conditions and, as a consequence, slowed the autumn advance of the sea ice cover. Sea ice extent in the Chukchi Sea remained well below average until the end of December 2018, when it reached near-average coverage (Fig. 6). Throughout the winter and spring, air temperatures continued to be 1-4°C warmer than the 1981-2010 average, which likely contributed to the low sea ice concentrations.
In spring 2019, melt onset across the Chukchi Sea occurred 20-35 days earlier than the 1981-2010 average. Sea ice began a rapid and accelerating retreat from the south in early May, leading to a record low sea ice extent that lasted until early August, with negative sea ice concentration anomalies of 50%. A combination of anomalously warm air temperatures (1-5°C above the 1981-2010 average) and southerly winds promoted this precipitous loss ice. As the sea ice retreated northward, exposed open water areas warmed, leading to anomalous sea surface temperatures greater than 5°C above average. By mid-September, sea ice coverage in the Chukchi Sea remained far below the 1981-2010 average. This reduction in sea ice coverage has continued far into the freeze-up period, with ice extent only one-third of the previous record minimum. Consistent with the long-term record of Arctic-wide ice loss, most characteristics of the sea ice in the Chukchi Sea, including the length of the melt season and area of open water subject to rapid warming in summer, are now entirely different compared to the first decade (1979-88) of the satellite record.
References
Cavalieri, D. J., C. L. Parkinson, P. Gloersen, and H. J. Zwally, 1996, updated yearly: Sea Ice Concentrations from Nimbus-7 SMMR and DMSP SSM/I-SSMIS Passive Microwave Data, Version 1. NASA National Snow and Ice Data Center Distributed Active Archive Center, Boulder, CO, USA, https://doi.org/10.5067/8GQ8LZQVL0VL.
Fetterer, F., K. Knowles, W. N. Meier, M. Savoie, and A. K. Windnagel, 2017 (updated daily): Sea Ice Index, Version 3: Regional Daily Data. National Snow and Ice Data Center (NSIDC), Boulder, CO, USA, https://doi.org/10.7265/N5K072F8.
Kwok, R., 2018: Arctic sea ice thickness, volume, and multiyear ice coverage: Losses and coupled variability (1958 – 2018). Environ. Res. Lett., 13 (2018), 105005, https://doi.org/10.1088/1748-9326/aae3ec.
Maslanik, J., and J. Stroeve, 1999: Near-Real-Time DMSP SSMIS Daily Polar Gridded Sea Ice Concentrations, Version 1. NASA National Snow and Ice Data Center Distributed Active Archive Center, Boulder, CO, USA, https://doi.org/10.5067/U8C09DWVX9LM.
Maslanik, J., J. Stroeve, C. Fowler, and W. Emery, 2011: Distribution and trends in Arctic sea ice age through spring 2011. Geophys. Res. Lett., 38(13), L13502, https://doi.org/10.1029/2011GL047735.
Meier, W. N., G. Hovelsrud, B. van Oort, J. Key, K. Kovacs, C. Michel, M. Granskog, S. Gerland, D. Perovich, A. P. Makshtas, and J. Reist, 2014: Arctic sea ice in transformation: A review of recent observed changes and impacts on biology and human activity. Rev. Geophys., 52(3), 185-217, https://doi.org/10.1002/2013RG000431.
NSIDC, March 2019: Arctic Sea Ice News and Analysis. Arctic sea ice maximum ties for seventh lowest in satellite record. http://nsidc.org/arcticseaicenews/2019/03/.
Ricker, R., S. Hendricks, L. Kaleschke, X. Tian-Kunze, J. King, and C. Haas, 2017: A weekly Arctic sea-ice thickness data record from merged CryoSat-2 and SMOS satellite data. Cryosphere, 11, 1607-1623, https://doi.org/10.5194/tc-11-1607-2017.
Tschudi, M., W. N. Meier, J. S. Stewart, C. Fowler, and J. Maslanik, 2019a: EASE-Grid Sea Ice Age, Version 4. Boulder, Colorado USA. NASA National Snow and Ice Data Center Distributed Active Archive Center. https://doi.org/10.5067/UTAV7490FEPB.
Tschudi, M., W. N. Meier, and J. S. Stewart, 2019b: Quicklook Arctic Weekly EASE-Grid Sea Ice Age, Version 1. Boulder, Colorado USA. NASA National Snow and Ice Data Center Distributed Active Archive Center. https://doi.org/10.5067/2XXGZY3DUGNQ.
Tschudi, M. A., C. Fowler, J. A. Maslanik, and J. A. Stroeve, 2010: Tracking the movement and changing surface characteristics of Arctic sea ice. IEEE J. Sel. Top. Appl. Earth Observ. Remote Sens., 3(4), 536-540, https://doi.org/10.1109/JSTARS.2010.2048305.
Tschudi, M. A., J. C. Stroeve, and J. S. Stewart, 2016: Relating the age of Arctic sea ice to its thickness, as measured during NASA’s ICESat and IceBridge Campaigns. Remote Sens., 8(6), 457, https://doi.org/10.3390/rs8060457.
November 22, 2019