
T. Schuur
Center for Ecosystem Science and Society, Northern Arizona University, Flagstaff, AZ, USA
Highlights
- Northern permafrost region soils contain 1,460-1,600 billion metric tons of organic carbon, about twice as much as currently contained in the atmosphere.
- This pool of organic carbon is climate-sensitive. Warming conditions promote microbial conversion of permafrost carbon into the greenhouse gases carbon dioxide and methane that are released to the atmosphere in an accelerating feedback to climate warming.
- New regional and winter season measurements of ecosystem carbon dioxide flux independently indicate that permafrost region ecosystems are releasing net carbon (potentially 0.3 to 0.6 Pg C per year) to the atmosphere. These observations signify that the feedback to accelerating climate change may already be underway.
Introduction
The Arctic continues to warm at a rate that is currently twice as fast as the global average (see essay Surface Air Temperature). Warming is causing perennially-frozen ground (permafrost) to thaw, with permafrost in many locations currently reaching record high temperatures (Biskaborn et al. 2019). Organic carbon contained in soils of the permafrost region represent a climate-sensitive carbon reservoir that is affected by warming air and ground temperatures and permafrost thaw. This permafrost carbon is the remnants of plants, animals, and microbes that have lived and died in tundra and boreal ecosystems, accumulating in frozen soil over hundreds to thousands of years (Schuur et al. 2008). The northern permafrost region holds almost twice as much carbon as is currently in the atmosphere. Additional net releases of carbon dioxide (CO2) and methane (CH4) to the atmosphere as a result of warming and faster microbial decomposition of permafrost carbon have the potential to accelerate climate warming. This report details recent advances in quantifying the amount of organic carbon stored in permafrost soils and the current exchange of CO2 between tundra and boreal ecosystems and the atmosphere. It updates material included in an essay on the terrestrial carbon cycle that appeared in Arctic Report Card 2016 (Schuur and Hugelius, 2016).
Permafrost carbon pools: How much permafrost carbon is available to release into the atmosphere?
The new, best mean estimate of the amount of organic carbon stored in the northern permafrost region is 1,460-1,600 petagrams (Pg; 1 Pg = 1 billion metric tons) (Hugelius et al. 2014; Schuur et al. 2015). Of this inventory, 65-70% (1,035 ± 150 Pg) of the carbon is within the surface layer (0-3 m depth) (Fig. 1). Soils in the top 3 m of the rest of Earth’s biomes (excluding Arctic and boreal biomes) contain 2,050 Pg of organic carbon (Jobbagy and Jackson 2000). The soil carbon from the northern circumpolar permafrost region adds another 50% to this 3-m inventory, even though it occupies only 15% of the total global soil area (Schuur et al. 2015).

A significant amount of carbon (25-30%) is also stored deeper (> 3 m depth) due to unique processes that bury carbon in permafrost region soils. In particular, the Yedoma region of Siberia and Alaska remained ice-free during the last Ice Age and accumulated silt (loess) soils, which buried large quantities of organic matter deep into the permafrost (Strauss et al. 2013). Recent work has reconciled several estimates for the Yedoma region, placing 327-466 Pg C in these deep loess deposits, which can be tens of meters thick (Schuur et al. 2018). This region contains intact Yedoma deposits that have remained primarily frozen since the last glacial period, and also deposits where abrupt permafrost thaw led to ground subsidence (thermokarst) and lake formation. These thermokarst lakes accumulated more carbon as lake ecosystems developed, and these deposits later re-froze into permafrost when the lakes drained (Anthony et al. 2014; Strauss et al. 2017). The remaining deep carbon accounted for in the total permafrost carbon inventory is contained in Arctic river deltas, which contain 96 ± 55 Pg C (< 10%). Permafrost thaw occurs when a warming climate affects permafrost temperature gradually from the surface downward. At the same time, abrupt permafrost thaw, related to the destabilization of and melting of ground ice, can affect tens of meters of permafrost rapidly over a single season. As a result, the entire organic carbon inventory of surface and deep soil reported here may be vulnerable to thaw in a changing climate.
Ecosystem-atmosphere carbon exchange: Is the Arctic currently releasing additional net carbon dioxide emissions to the atmosphere?
Permafrost thaw and increased microbial decomposition releases stored organic carbon from the terrestrial biosphere into the atmosphere as greenhouse gases. At the same time, plant growth sequesters atmospheric CO2, which becomes stored as new plant biomass or deposited as new soil organic matter. Direct and indirect effects linked to climate warming can stimulate both processes, and whether Arctic ecosystems are currently a net carbon source (losses > gains) or sink (gains > losses) is an area of intense research. Ecosystem carbon balance (net gain or loss of ecosystem carbon) is the relatively small difference between two large, opposing fluxes: plant carbon uptake via plant photosynthesis and growth versus respiratory loss via metabolism by all living organisms (Fig. 2). Across the landscape, this biological carbon cycle is then modified by relatively rapid physical disturbances, such as fire and abrupt permafrost thaw (thermokarst) that accelerate carbon losses while modifying rates of carbon gain. Carbon dioxide represents the main form, by weight, of carbon exchanged between ecosystems and the atmosphere. Methane exchange is a much smaller amount by weight than CO2, and consequently does not greatly alter ecosystem carbon balance at the landscape scale. The larger warming potential of CH4 means that changing emissions can affect climate, but these impacts are outside of the scope of this report.
Northern tundra and boreal ecosystems typically gain carbon (carbon sink) stored in plant biomass and new soil organic matter during the short summer growing season when plant photosynthesis and growth is greater than carbon respired by plants and soil back to the atmosphere. In any given year, individual ecosystems can have gains or losses in net carbon due to changes in the physical and biological environment (Treat et al. 2018), and also depending on the successional stage of the ecosystem, but what matters to future climate is the aggregate response across the regions over years to decades.
Previous efforts to synthesize ecosystem carbon balance focused on CO2 flux measurements have produced results that have not agreed. For instance, a study that scaled plot CO2 flux measurements to regional land area reported a net annual carbon exchange in the tundra region of 0.013 Pg C per year (i.e., a small sink but near neutral exchange) over the 1990s and 2000s (McGuire et al. 2012). A follow-up study focused on a subset of the same tundra sites and also included new sites with additional non-summer data to bolster the under-sampled cold season (Belshe et al. 2013). The second study supported the previous finding that the summer-season carbon sink increased in the 2000s compared with the 1990s. However, the second study also suggested that the mean tundra flux remained a carbon source annually across both decades when additional non-summer flux data were included. When scaled to a similar-sized region, the second study predicted that the tundra was acting as a current source of 0.462 Pg C per year. One potential explanation for the difference between these two comprehensive synthesis studies was the inclusion (in the former), and exclusion (in the latter) of fluxes measured in wetland ecosystems. Wetlands generally store more carbon in anaerobic soils, and typically act as annual net carbon sinks even while CH4 is emitted (Lund et al. 2010). This differential response of individual ecosystem types and the relative scarcity of measurement sites across the Arctic region continue to make it difficult to upscale to the aggregate effect of ecosystems’ greenhouse gas exchange on the atmosphere.
Another approach to this same question is to measure changes in atmospheric greenhouse gas concentrations and to separate out contributions from different sources. Given the extent of fossil fuel carbon emissions, it remains a challenge to quantify and separate the effect of ecosystem carbon exchange, but regional atmospheric measurement campaigns can help to focus in on local influences (Parazoo et al. 2016). Recent measurements of atmospheric greenhouse gas concentrations over Alaska by NASA aircraft have been used to the estimate the net regional impact on the atmosphere by those Arctic and boreal ecosystems for 2012 to 2014 (Commane et al. 2017). This recent NASA campaign was able to provide important insight into the aggregate influence of the carbon exchange for the Alaska permafrost region, across tundra, boreal forests, and wetland/lake/freshwater ecosystems as a whole. During this three-year time period, the tundra region of Alaska was found to be a consistent net CO2 source to the atmosphere, whereas the boreal forest region was either neutral or a net CO2 sink. The boreal forest region exhibited larger interannual variability due both to changes in the balance of photosynthesis and respiration and to the amount of combustion emissions by wildfire.
The Alaska study region as a whole was estimated to be a net carbon source of 0.025 ± 0.014 Pg C per year averaged over the land area of both tundra and boreal forest regions for the three-year study period. If this Alaskan region (1.6 × 10⁶ km2) was representative of the entire northern circumpolar permafrost region soil area (17.8 × 10⁶ km2), this amount would be equivalent to a circumpolar net source of 0.3 Pg C per year. Historically (over hundreds to thousands of years), the Arctic region was accumulating carbon in soils and vegetation and thus was acting as a net sink of atmospheric CO2. Assuming this three-year snapshot provided by NASA aircraft monitoring is indicative of the Arctic’s current physical and biological environment, a significant and major threshold has been crossed in the high latitude region whereas the aggregate effect of terrestrial ecosystems is now contributing to, rather than slowing, climate change.
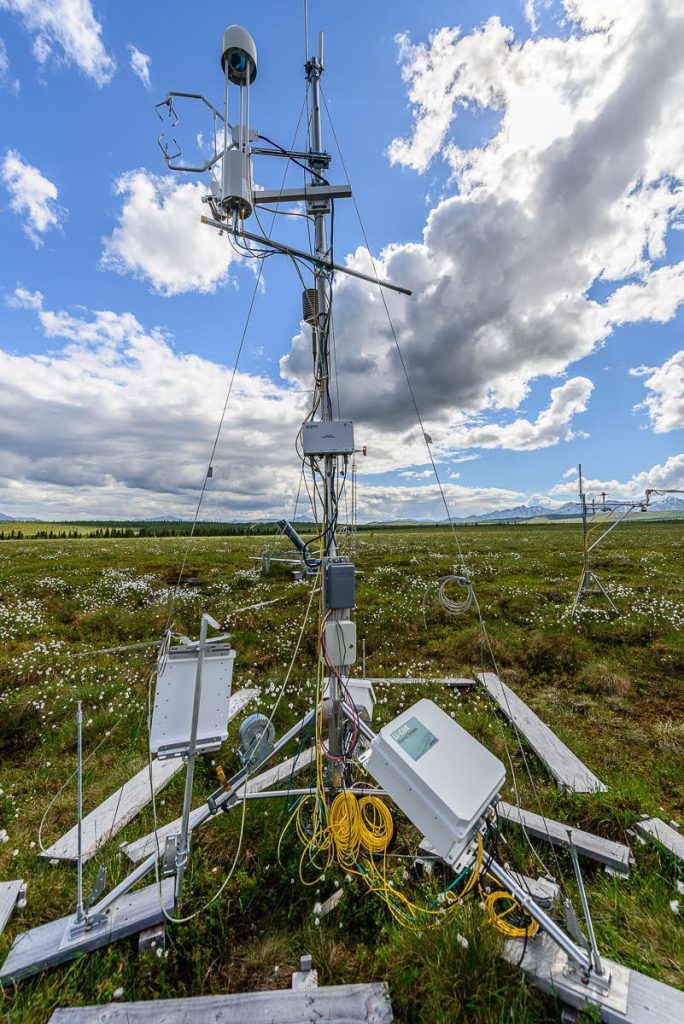
Aircraft measurements of atmospheric greenhouse gas concentrations help to describe the combined regional impact of changing permafrost region ecosystems. However, the long cold Arctic winter (or non-summer) season limits observations from the air, just as it has limited ground-based observations in the past due to the difficult operating conditions. For example, the NASA aircraft campaign made atmospheric measurements from April through November only. In one of the recent synthesis studies of ground-based measurements, the regional carbon balance estimate for the North American subregion, for example, had 80 study-years of summer measurements and only 9 study-years of non-summer measurements available for upscaling (McGuire et al. 2012). The summer growing season is typically a time when net carbon is stored within growing ecosystems acting as a seasonal carbon sink. However, summer carbon sequestration is partially offset by carbon losses in fall, winter, and spring when microbes remain metabolically active and release CO2 during a period where plants are largely dormant. While absolute levels of CO2 flux are low during the non-summer season, the long period of more than 250 days can be enough to offset the net carbon that accumulated during summer.
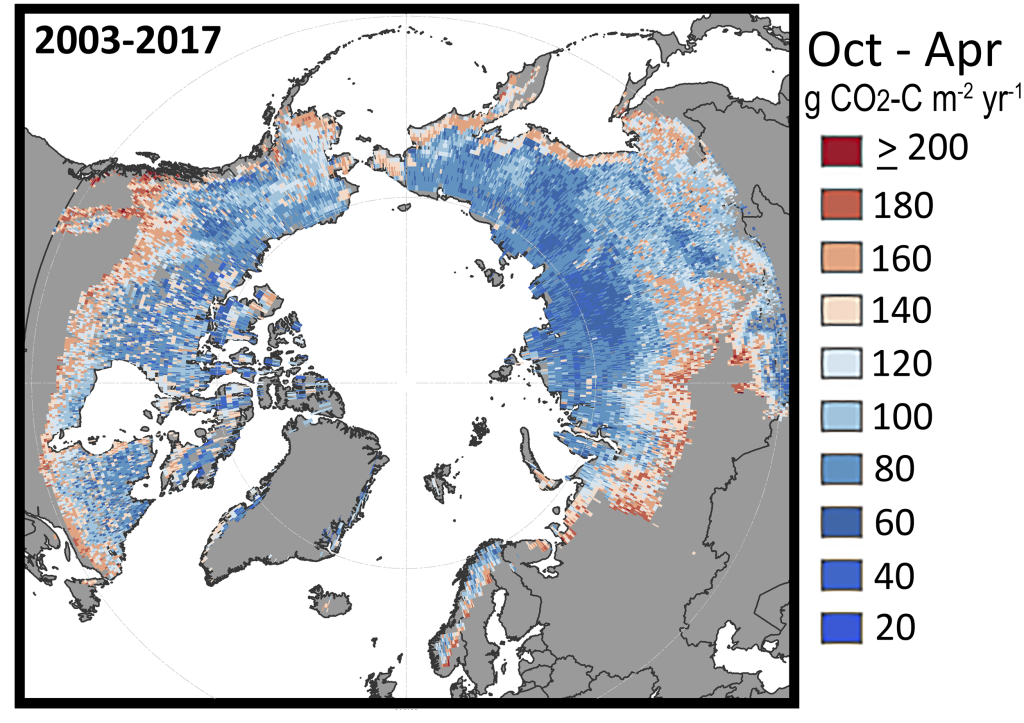
A new comprehensive synthesis study of non-summer ecosystem CO2 fluxes across the circumpolar region showed that carbon release during the Arctic winter was 2 to 3 times higher than previously estimated from ground-based measurements (Fig. 3) (Natali et al. 2019). This circumpolar estimate suggests that carbon release in the cold season offsets net carbon uptake during the growing season (derived from models) such that the region as a whole could already be a source of 0.6 Pg C per year to the atmosphere. It was not possible to determine whether these higher flux estimates were a result of changing environmental conditions or the aggregation of more observations during this scarcely observed non-summer period. Regardless, similar to the regional extrapolation made by aircraft, this winter flux synthesis supports the idea that the accelerating feedback from changing permafrost ecosystems to climate change may already be underway.
References
Anthony, K. M. W., and Coauthors, 2014: A shift of thermokarst lakes from carbon sources to sinks during the Holocene epoch. Nature, 511, 452, https://doi.org/10.1038/Nature13560.
Belshe, F. E., A. G. Schuur, and B. M. Bolker, 2013: Tundra ecosystems observed to be carbon dioxide sources due to differential amplification of the carbon cycle. Ecol. Lett., https://doi.org/10.1111/ele.12164.
Biskaborn, B. K., and Coauthors, 2019: Permafrost is warming at a global scale. Nat. Commun., 10(1), 264, https://doi.org/10.1038/s41467-018-08240-4.
Commane, R., and Coauthors, 2017: Carbon dioxide sources from Alaska driven by increasing early winter respiration from Arctic tundra. P. Natl. Acad. Sci. USA, 114(21), 5361-5366, https://doi.org/10.1073/pnas.1618567114.
Hugelius, G., and Coauthors, 2014: Estimated stocks of circumpolar permafrost carbon with quantified uncertainty ranges and identified data gaps. Biogeosciences, 11, 6573-6593, https://doi.org/10.5194/bg-11-6573-2014.
Jobbágy, E. G., and R. B. Jackson, 2000: The vertical distribution of soil organic carbon and its relation to climate and vegetation. Ecol. Appl., 10(2), 423-436, https://doi.org/10.1890/1051-0761(2000)010[0423:TVDOSO]2.0.CO;2.
Lund, M., and Coauthors, 2010: Variability in exchange of CO2 across 12 northern peatland and tundra sites. Glob. Change Biol., 16(9), 2436-2448, https://doi.org/10.1111/j.1365-2486.2009.02104.x.
McGuire, A. D., T. R. Christensen, D. Hayes, A. Heroult, E. Euskirchen, J. S. Kimball, C. Koven, P. Lafleur, P. A. Miller, W. Oechel, P. Peylin, M. Williams, and Y. Yi, 2012: An assessment of the carbon balance of Arctic tundra: Comparisons among observations, process models, and atmospheric inversions. Biogeosciences, 9(8), 3185-3204, https://doi.org/10.5194/bg-9-3185-2012.
Natali, S., and Coauthors, 2019: Large loss of CO2 in winter observed across pan-Arctic permafrost region. Nat. Climate Change, 9, 852-857, https://doi.org/10.1038/s41558-019-0592-8.
Parazoo, N. C., R. Commane, S. C. Wofsy, C. D. Koven, C. Sweeney, D. M. Lawrence, J. Lindaas, R. Y. -W. Chang, and C. E. Miller, 2016: Detecting regional patterns of changing CO2 flux in Alaska. P. Natl. Acad. Sci. USA, 113(28), 7733-7738, https://doi.org/10.1073/pnas.1601085113.
Schuur, E. A. G., and Coauthors, 2008: Vulnerability of permafrost carbon to climate change: Implications for the global carbon cycle. Bioscience, 58, 701-714.
Schuur, E. A. G., and Coauthors, 2015: Climate change and the permafrost carbon feedback. Nature, 520, 171-179, https://doi.org/10.1038/nature14338.
Schuur, E. A. G., and Coauthors, 2018: Chapter 11: Arctic and boreal carbon. In: Second State of the Carbon Cycle Report (SOCCR2): A Sustained Assessment Report, Cavallaro, N., G. Shrestha, R. Birdsey, M. A. Mayes, R. G. Najjar, S. C. Reed, P. Romero-Lankao, and Z. Zhu, Eds., U.S. Global Change Research Program, Washington, DC, USA, 428-468.
Schuur, T., and G. Hugelius, 2016: Terrestrial carbon cycle. Arctic Report Card 2016, J. Richter-Menge, J. E. Overland, and J. Mathis, Eds. http://www.arctic.noaa.gov/Report-Card.
Strauss, J., L. Schirrmeister, G. Grosse, S. Wetterich, M. Ulrich, U. Herzschuh, and H. -W. Hubberten, 2013: The deep permafrost carbon pool of the Yedoma region in Siberia and Alaska. Geophys. Res.Lett., 40, 6165-6170, https://doi.org/10.1002/2013gl058088.
Strauss, J., L. Schirrmeister, G. Grosse, D. Fortier, G. Hugelius, C. Knoblauch, V. Romanovsky, C. Schädel, T. Schneider von Deimling, E. A. G. Schuur, D. Shmelev, M. Ulrich, and A. Veremeeva, 2017: Deep Yedoma permafrost: A synthesis of depositional characteristics and carbon vulnerability. Earth-Sci. Rev., 172, 75-86, https://doi.org/10.1016/j.earscirev.2017.07.007.
Treat, C. C., M. E. Marushchak, C. Voigt, Y. Zhang, Z. Tan, Q. Zhuang, T. A. Virtanen, A. Räsänen, C. Biasi, G. Hugelius, D. Kaverin, P. A. Miller, M. Stendel, V. Romanovsky, F. Rivkin, P. J. Martikainen, and N. J. Shurpali, 2018: Tundra landscape heterogeneity, not interannual variability, controls the decadal regional carbon balance in the Western Russian Arctic. Glob. Change Biol., 24, 5188-5204, https://doi.org/10.1111/gcb.14421.
November 22, 2019