
P. J. Stabeno1, R. L. Thoman2, and K. Wood1,3
1Pacific Marine Environmental Laboratory, NOAA, Seattle, WA, USA
2International Arctic Research Center, University of Alaska Fairbanks, Fairbanks, AK, USA
3Joint Institute for the Study of the Atmosphere and Ocean, University of Washington, Seattle, WA, USA
Highlights
- There has been a marked decrease in sea-ice extent in the Bering Sea during the last two years.
- Record-breaking warm ocean temperatures occurred in 2019 on the southern Bering shelf, while bottom temperatures on the northern Bering shelf exceeded 4°C for the first time in November 2018.
- Loss of sea ice and increasing ocean temperatures have impacted the Bering Sea ecosystem, including northward migration of fish species.
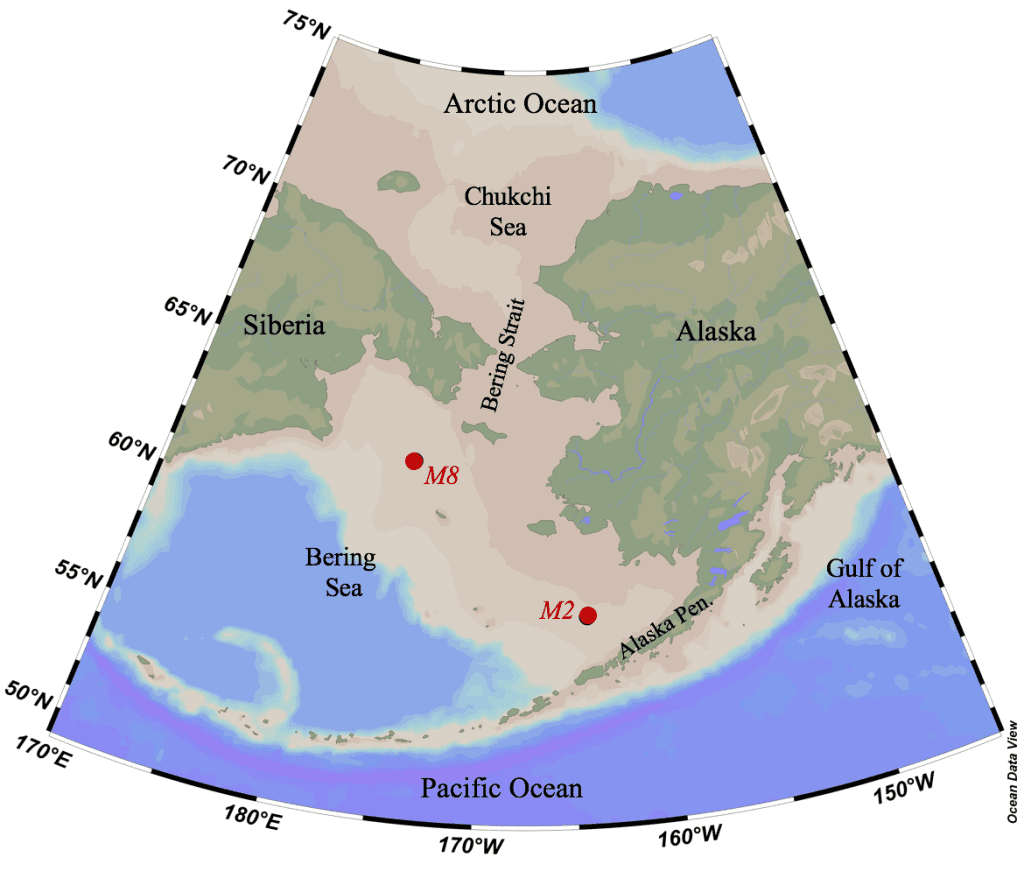
The Bering Sea is the third largest semi-enclosed sea in the world and forms the transition between the subarctic North Pacific Ocean and the Arctic Ocean (Fig. 1). The western half of the sea consists of a basin (<3500 m depth) and a narrow (<100 km wide) shelf along the Russian coast south of Cape Navarin. The eastern half of the sea is a broad (~500 km) shelf stretching >1100 km northward from the Alaska Peninsula. This article focuses on the eastern shelf, which has an exceptionally productive ecosystem, supporting large numbers of seabirds and marine mammals, subsistence harvests for native communities across Alaska, and more than 40% of the annual U.S. catch of fish and shellfish (valued at > $1 billion annually). Sea ice is a critical factor in structuring this ecosystem. For the past two winters (2018 and 2019), maximum sea-ice extent in the Bering Sea has been at record lows, less than half of the long-term mean (1980-2010). These highly visible declines in sea ice occurred against a background of long-term warming and ice volume loss across the Arctic (see essay Sea Ice; Kwok 2018).
Historically, the eastern Bering Sea shelf (EBS; that region east of 178° E) has been seasonally ice-covered. The highest maximum sea-ice extent in the region, during the satellite era (1979-present), was 1.1 × 10⁶ km2 on 21 March 2012. The lowest maximum sea-ice extent (3.8 × 10⁵ km2) occurred just six years later on 17 March 2018 (Stabeno and Bell 2019). Maximum areal ice cover in winter 2019 was more extensive (4.9 × 10⁵ km2) than the 2018 record and occurred almost two months earlier on 25 January (Fig. 2a). The sea-ice extent in January 2019 was near average, but the ice was thin (Thompson 2018; Stabeno and Bell 2019). This thinness is attributable to: (1) late ice arrival (approximately a month later than usual) and its rapid advancement; and (2) warmer-than-average water temperatures (>0°C; Fig. 2b) in the northern Bering Sea (NBS) at mooring M8, which melted the bottom of ice floes and thus limited the thickness of the ice.

In late January 2019 wind patterns changed and a series of five strong, warm cyclones entered the Bering Sea (Fig. 3), breaking up the thin ice and driving it northward. Minimum winter sea-ice extent in the EBS occurred in early March (Fig. 2a). From late January to early March, areal ice cover was reduced by 82% (a retreat of 4.0 × 10⁵ km2), the largest percent retreat ever observed in the satellite record during January or February. The absolute magnitude of ice retreat was second only to 1989 (4.2 × 10⁵ km2), a year that had one of the most extensive January ice covers on record (1979-2019). The large ice retreat in winter 2019 was primarily a result of a >30 day period of warm, southerly winds. In mid-March 2019 the winds reversed and once again came out of the north, driving the ice southward (Fig. 2a). Consequently, the sea-ice extent recovered somewhat, but remained relatively low through the rest of the season (e.g., Mar 21 in Fig. 2a).

Sea-ice extent and timing of ice retreat have important impacts on the Bering Sea ecosystem. Depth-averaged water temperature was calculated at M2, a long-term (1995-2019) ecosystem mooring on the southern Bering Sea shelf (Fig. 2a). Ice extent at M2 in March-April is the primary determinant of ocean temperature for the following summer (Stabeno et al. 2012). Years with sea ice (>5% areal cover in the 50 km × 50 km box around M2) in March-April (gray lines; Fig. 2c) are characterized by cold ocean temperatures, while years with little-or-no sea ice (yellow lines) are characterized by warm water. The years with the warmest ocean temperatures (2016 and 2019) followed extremely warm years (2015 and 2018, respectively). That is, some heat from 2015 and 2018 persisted through the winter, providing warmer starting conditions for summer heating in 2016 and 2019, respectively.
Prior to 2016, the NBS (defined as north of 60° N) had extensive and persistent sea ice and bottom temperatures that remained <2°C throughout the year. In December 2016 and January 2017, bottom temperatures rose to above 2°C because of the late arrival of sea ice (Fig. 2b). Winds mixed the summer surface heat vertically, and the lack of cooling by subsequent ice growth resulted in >2°C near-bottom temperatures. Sea-ice extent the following year (February-March 2017) was low, but within the range of previous observations. Periods of warm, southerly winds in fall 2017 and winter 2018 resulted in extremely low ice extent and virtually no sea ice at mooring site M8 (Fig. 2a). This lack of ice resulted in very warm bottom waters at M8 in summer 2018 (Fig. 2b). Bottom temperatures in November 2018 were the warmest ever observed, ~2°C above the previous high. In 2019, there was more sea ice at M8; hence the bottom temperatures were not as warm as observed in 2018, but were warmer than observed in previous decades (Fig. 2b).
Unlike the pelagic-dominated southern Bering Sea ecosystem, the NBS is characterized by a productive benthic ecosystem (Grebmeier et al. 2006), aided by lipid-rich ice algae that fall to the sea floor as the sea ice melts (Duffy-Anderson et al. 2019). While there is often a subsurface summer phytoplankton bloom on the NBS shelf (Sigler et al. 2014), the largest increases in chlorophyll fluorescence at M8 usually occur with the retreat of sea ice. Chlorophyll fluorescence is related to phytoplankton and algal biomass. Fluorometers, which measure chlorophyll fluorescence, are positioned on moorings and the time series they collect provide an excellent indication of the timing of the primary production. The chlorophyll-fluorescence time series (depth of ~22 m) at M8 in 2018, and again in 2019, showed no evidence of elevated chlorophyll prior to the well-defined increases in June. In other words, there was no ice-associated increase in chlorophyll. Instead, these blooms were typical of open water, like the phytoplankton blooms characteristic of the southern shelf. In 2018, there was likely no export of lipid-rich ice algae to the benthos over much of the northern shelf. During spring/summer 2018, there was an abundance of small low-lipid-content zooplankton and low concentration of lipid-rich large zooplankton. This pattern is common in low ice years in the southern Bering Sea (Duffy-Anderson et al. 2019), but measurements in the NBS are more limited and patterns are less clear.
In 2018, there was a marked northward shift in the distribution of walleye pollock (Gadus chalcogrammus) and Pacific cod (Gadus macrocephalus) over the Bering Sea shelf. Typically, these species are found on the southern shelf and/or along the outer shelf where bottom temperatures are usually >2°C. In 2019, both pollock and Pacific cod were, once again, found in large numbers on the northern shelf. This change in distribution was likely related to the cold pool (the region on the shelf where summer bottom temperatures are <2°C). In 2018, the cold pool was almost non-existent (Stabeno et al. 2019). In 2019, while larger than in 2018, the cold pool was still well below its typical extent (Fig. 2a).
As in 2018, there were seabird die-offs on the Bering Sea shelf in 2019 (US Fish & Wildlife Service 2019). The largest die-offs, primarily on the southern shelf, affected short-tailed shearwaters (Ardenna tenuirostris), which washed ashore in July and August in Bristol Bay. While the underlying cause of the die-off is likely linked to warmer ocean conditions, the exact mechanism is not known. Possibilities include: northward expansion of pollock and Pacific cod competing with shearwaters for food in the northern Bering Sea; increased toxins from harmful algal blooms; or other as yet unknown mechanisms.
These past two years of low ice extent were likely a result of three factors. First and foremost, abnormally warm, southerly winds during winter limited sea-ice extent and/or forced substantial ice retreat in the winter. Second, the late freeze-up in winter of 2017 and 2018 of the southern Chukchi Sea delayed ice arrival in the NBS. Finally, warm ocean temperatures slowed the advance of ice. Given the very late freeze-up in Chukchi Sea in 2019 (see essay Sea Ice), it is likely that ocean temperatures in the NBS will be above normal, however the influence of winter wind patterns on sea-ice extent and, in turn, on ocean temperatures remains difficult to predict.
Acknowledgments
We acknowledge the use of imagery from the NASA Worldview application (https://worldview.earthdata.nasa.gov), part of the NASA Earth Observing System Data and Information System (EOSDIS). NCEP Reanalysis data were provided by the NOAA/OAR/ESRL PSD, Boulder, Colorado, USA, from the Web site at https://www.esrl.noaa.gov/psd/. This research is contribution EcoFOCI 5024 to NOAA’s Ecosystems and Fisheries Oceanography Coordinated Investigations program, and PMEL contribution number 5024.
References
Duffy-Anderson, J. T., P. Stabeno, A. G. Andrews, K. Cieciel, A. Deary, E. Farley, C. Fugate, C. Harpold, R. Heintz, D. Kimmel, K. Kuletz, J. Lamb, M. Paquin, S. Porter, L. Rogers, A. Spear, and E. Yasumiishi, 2019: Responses of the northern Bering Sea and southeastern Bering Sea pelagic ecosystems following record-breaking low winter sea-ice. Geophys. Res. Lett., 46(16), 9833-9842, https://doi.org/10.1029/2019GL083396.
Grebmeier, J. M., J. E. Overland, S. E. Moore, E. V. Farley, E. C. Carmack, L. W. Cooper, K. E. Frey, J. H. Helle, F. A. McLaughlin, and S. L. McNutt, 2006: A major ecosystem shift in the northern Bering Sea. Science, 311(5766), 1461-1464, https://doi.org/10. 1126/science.1121365.
Kwok, R., 2018: Arctic sea ice thickness, volume, and multiyear ice coverage: Losses and coupled variability (1958-2018). Environ. Res. Lett., 13, 105005, https://doi.org/10.1088/1748-9326/aae3ec.
Mesinger, F., G. DiMego, E. Kalnay, K. Mitchell, P. C. Shafran, W. Ebisuzaki, D. Jović, J. Woollen, E. Rogers, E. H. Berbery, M. B. Ek, Y. Fan, R. Grumbine, W. Higgins, H. Li, Y. Lin, G. Manikin, D. Parrish, and W. Shi, 2006: North American regional reanalysis. Bull. Amer. Meteor. Soc., 87, 343-360, https://doi.org/10.1175/BAMS-87-3-343.
Sigler, M. F., P. J. Stabeno, L. B. Eisner, J. M. Napp, and F. J. Mueter, 2014: Spring and fall phytoplankton blooms in a productive subarctic ecosystem, the eastern Bering Sea, during 1995-2011. Deep-Sea Res. Pt. II, 109, 71-83, https://doi.org/10.1016/j.dsr2.2013.12.007.
Stabeno, P. J., and S. W. Bell, 2019: Extreme conditions in the Bering Sea (2017-2018): Record breaking low sea-ice extent. Geophys. Res. Lett., 46(15), 8952-8959, https://doi.org/10.1029/2019GL083816.
Stabeno, P. J., S. W. Bell, N. A. Bond, D. G. Kimmel, C. W. Mordy, and M. E. Sullivan, 2019: Distributed Biological Observatory Region 1: Physics, chemistry and plankton in the northern Bering Sea. Deep-Sea Res. Pt. II, 162, 8-21, https://doi.org/10.1016/j.dsr2.2018.11.006.
Stabeno, P. J., N. B. Kachel, S. E. Moore, J. M. Napp, M. Sigler, A. Yamaguchi, and A. N. Zerbini, 2012: Comparison of warm and cold years on the southeastern Bering Sea shelf and some implications for the ecosystem. Deep-Sea Res. Pt. II, 65-70, 31-45, https://doi.org/10.1016/j.dsr2.2012.02.020.
Thompson, A., 2018: Shock and thaw – Alaskan sea ice just took a steep, unprecedented dive. Sci. Am., May 2, 2018, https://www.scientificamerican.com/article/shock-and-thaw-alaskan-sea-ice-just-took-a-steep-unprecedented-dive/.
US Fish & Wildlife Service, 2019: 2019 Alaska Seabird Die-off Fact Sheet 508C (revised 9 September 2019), https://www.nps.gov/subjects/aknatureandscience/upload/9Sep2019-Die-Off-USFWS-Factsheet-508C-revised-29Aug.pdf.
December 6, 2019