
T. J. Ballinger1, J. E. Overland2, M. Wang2,3, U. S. Bhatt4, E. Hanna5, I. Hanssen-Bauer6, S. -J. Kim7, R. L. Thoman1, and J. E. Walsh1
1International Arctic Research Center, University of Alaska Fairbanks, Fairbanks, AK, USA
2Pacific Marine Environmental Laboratory, NOAA, Seattle, WA, USA
3Cooperative Institute for Climate, Ocean, and Ecosystem Studies, University of Washington, Seattle, WA, USA
4Geophysical Institute, University of Alaska Fairbanks, Fairbanks, AK, USA
5School of Geography and Lincoln Centre for Water and Planetary Health, University of Lincoln, Lincoln, UK
6Norwegian Meteorological Institute, Blindern, Oslo, Norway
7Korea Polar Research Institute, Incheon, Republic of Korea
Highlights
- October 2019-September 2020 represented the second warmest 12-month period of observed surface air temperatures (SAT) over Arctic land during the last century.
- Remarkably warm Siberian SAT occurred in the first half of 2020, with near-surface air temperatures 3-5°C above average during boreal winter (JFM) and spring (AMJ).
- A persistent, strong, and zonal jet stream over the mid-to-high latitudes led to warmer than average SAT over northern Eurasia and colder than normal SAT over Alaska and Greenland in winter and spring.
Introduction
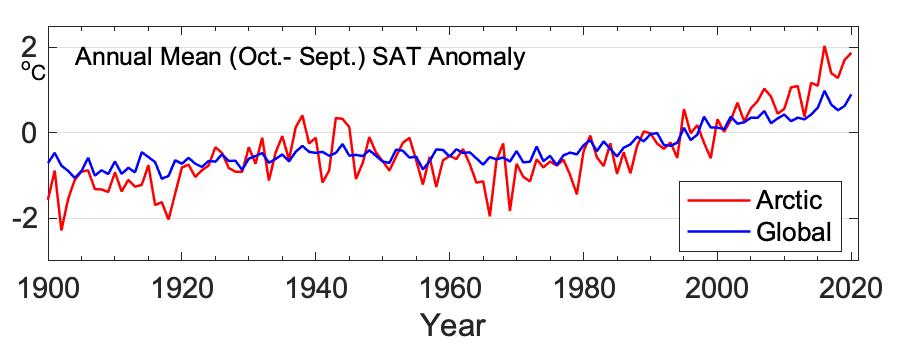
Surface air temperatures (SAT) represent one of the strongest indicators of Arctic change over the last 50 years (Box et al. 2019). While SAT patterns across the Arctic vary on a seasonal and annual basis, there has been a strong, positive trend toward warming pan-Arctic land SAT over the last five decades (Fig. 1). This warming has distinctly impacted the Arctic cryosphere, most notably through the decline of sea-ice extent across the annual cycle (Stroeve and Notz 2018; see essay Sea Ice), decreased mass balance of ice sheets and glaciers (Hanna et al. 2020; see essay Greenland Ice Sheet), and increased permafrost temperatures (Biskaborn et al. 2019). Ecosystems in the region are also highly sensitive to SAT trends and extreme temperature events. For example, increased trends in terrestrial vegetation productivity and “greening” of the Arctic tundra are largely attributed to the strong influence of multidecadal SAT warming (Myers-Smith et al. 2020; see essay Tundra Greenness). These warming-induced Arctic system changes have been especially pronounced during the last 15 years, spanning the history of the Arctic Report Card. In this essay, we summarize the seasonal and annual Arctic SAT conditions over the last year (October 2019-September 2020), relative to recent decades.
Mean annual surface air temperature over Arctic lands
The Arctic annual mean SAT anomaly for October 2019 through September 2020 was 1.9°C warmer than the 1981-2010 average for land areas between 60 and 90°N (Fig. 1). This marks the second highest observed SAT anomaly behind 2016 for Arctic lands since at least 1900 and continues a current pattern of 7 consecutive years (and 9 of the last 10 years) where SAT anomalies were at least 1°C warmer than the 1981-2010 mean. Since 2000, average Arctic SAT anomalies have more than doubled global anomalies (Fig. 1) due to a phenomenon known as Arctic Amplification, which is likely driven by a combination of processes that operate on different space and time scales. Heat and moisture transport through atmospheric circulation and winds, as well as oceanic heat transport to the Arctic from low-to-middle latitudes, contribute to the enhanced warming on an annual scale. Mechanisms within the Arctic also modulate air temperatures, and these processes tend to vary by the season. For example, terrestrial snow and sea-ice cover losses resulting in a decrease in surface albedo tend to be major factors driving summertime warming, while tropospheric temperature and cloud-radiative feedbacks play a major role in air temperature increases during winter months (Pithan and Mauritsen 2014; Cohen et al. 2020).
Seasonal surface air temperature patterns
To provide seasonal perspectives, patterns of near-surface air temperature anomalies and extremes are highlighted for autumn 2019 (October-December [OND]) and winter (January-March [JFM]), spring (April-June [AMJ]), and summer (July-September [JAS]) 2020 (Fig. 2). These seasonal divisions are used to coincide with annual cycles of key Arctic components, such as the melt onset of snow and sea-ice cover during spring and the September sea-ice minimum.
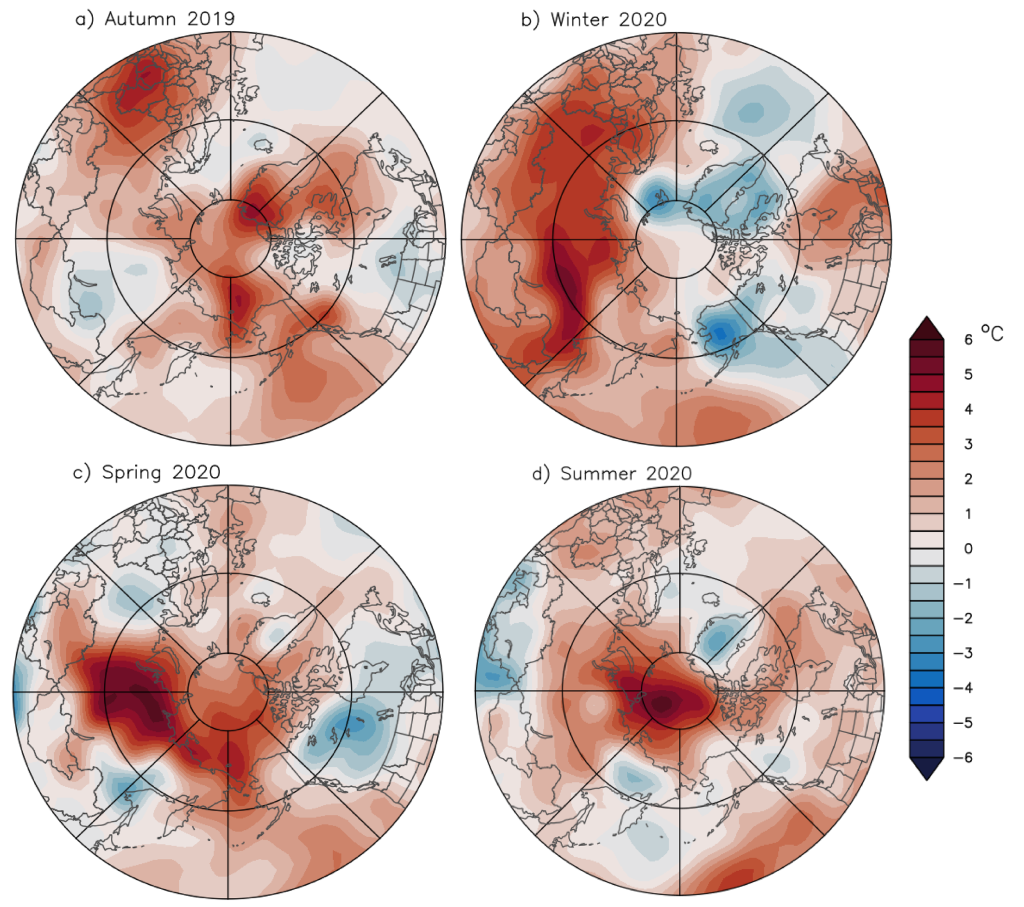
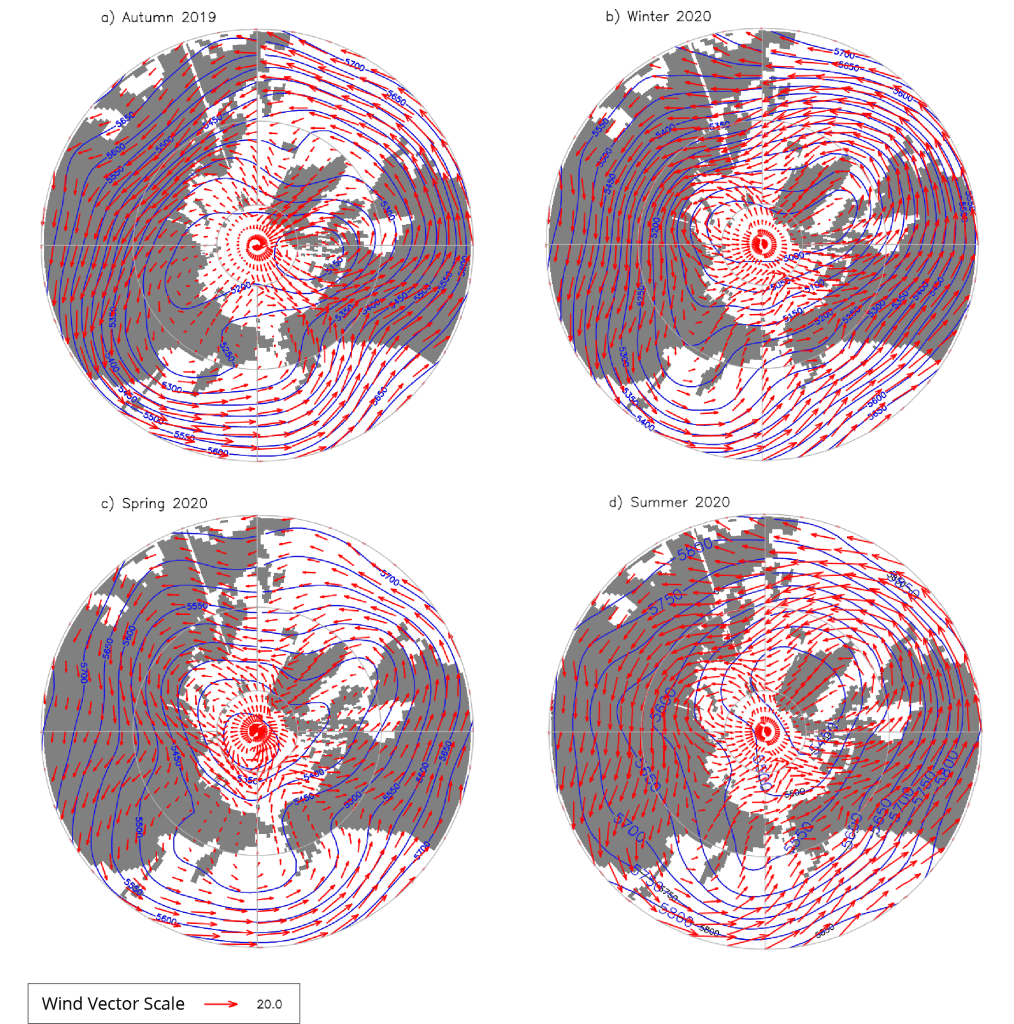
Autumn 2019. Positive (i.e., relatively warm) air temperature anomalies were found across most of the Arctic Ocean (Fig. 2a). The largest anomalies (4°C) were found in the Chukchi Sea and across northern Greenland. Similar to autumn 2018 (see essay Sea Ice in Arctic Report Card 2019), freeze-up in the Chukchi Sea, as well as in the Laptev and Kara Seas, in 2019 was slowed by diminished sea ice and retention of heat from the previous summer in the upper ocean (see essays Sea Surface Temperature and Sea Ice). The transfer of this upper ocean heat to the atmosphere likely played a major role in the air temperature anomalies, especially in the absence of southerly winds into the region, which are more typically responsible for the transport of warm air into the region (Fig. 3a). A trough over the Canadian Archipelago helped transport warm air from the south to support the development of large positive air temperature anomalies over northern Greenland (see essay Greenland Ice Sheet).
Winter 2020. The winter air temperature patterns were characterized by above-average temperature anomalies stretching from eastern Europe to central Siberia. An extensive area of air temperature anomalies of 3-5°C occurred in north-central Siberia (Fig. 2b). In contrast, areas extending eastward from Alaska to Greenland and Svalbard showed abnormally cold air temperatures. For example, Svalbard weather stations observed winter temperatures 1.4-2.6°C below normal. It was a particularly cold March at Svalbard Airport and Ny-Ålesund where monthly average air temperatures were 3°C and 4.5°C below average, respectively (https://klimaservicesenter.no/observations/). Arctic Alaska was also anomalously cold and stormy, with the North Slope experiencing the lowest average winter SAT since 2012 (1.4°C below average) marked by the coldest February (5.1°C below average) since 1990 (https://www.ncdc.noaa.gov/cag/divisional/time-series).
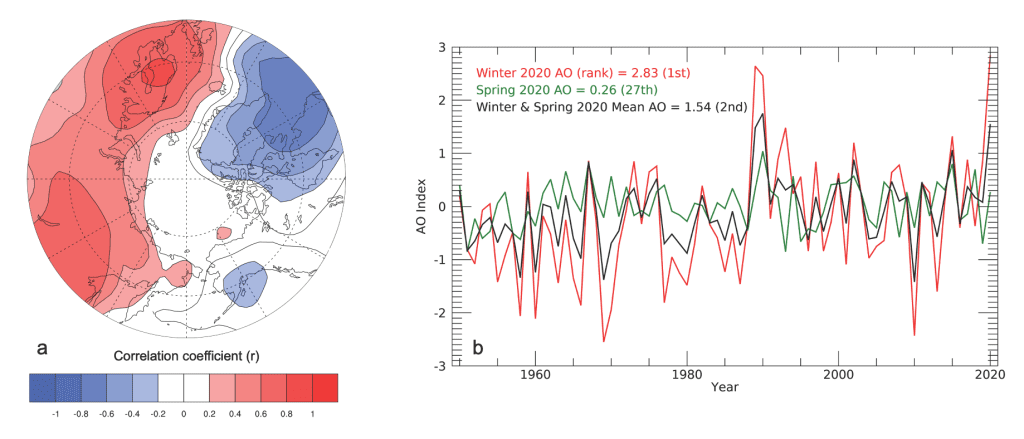
A persistent, strong jet stream over the mid-to-high latitudes this past winter (Fig. 3b) supported westerly winds, stormy weather conditions, and relatively mild northern Eurasian temperatures, and conversely trapped frigid Arctic air over Atlantic Arctic waters and the Alaskan and Greenland sectors of the North American Arctic. This anomalous circulation pattern impacted the MOSAiC Expedition, accelerating the icebreaker’s drift across the central Arctic Ocean (see essay MOSAiC). These warm air temperature anomalies (Fig. 2b) and zonal jet stream orientation (air flow parallel to latitude lines; Fig. 3b) reflect common conditions that occur during the positive phase of the Arctic Oscillation (AO). The AO is an index used to describe the Northern Hemisphere mid-to-high latitude atmospheric circulation. Figure 4a shows the strong, positive correlation between winter AO and near-surface air temperature across Eurasia (i.e., AO and air temperature increases are closely related) and strong, negative correlation across much of the eastern Canadian Arctic, Greenland, and northwest Atlantic Arctic waters. These relationships are relevant to winter 2020, as the AO index was at a record high dating back to 1950 (winter AO = 2.83; Fig. 4b), supporting the observed regional patterns of Arctic air temperature extremes, including the above-average temperatures over north-central Siberia.
Spring 2020. Warm air temperature anomalies characterized much of the Arctic Ocean and coastal zones during spring (Fig. 2c). Persisting from winter, warm air temperatures continued over north-central Siberia with near-surface air temperatures 5°C above the 1981-2010 mean. Late June was especially warm in the region, with 38°C (100.4°F) observed at Verkhoyansk, Russia, on 20 June (Overland and Wang 2020). The relatively warm air temperatures and warm air advection in this region prompted record-low spring snow cover extent (see essay Terrestrial Snow Cover) and early onset of sea-ice melt along the Eurasian Arctic coast. The sea-ice melt season in the Laptev and Kara Seas began nearly 30 days earlier than the 1981-2010 average (http://nsidc.org/arcticseaicenews/2020/08/steep-decline-sputters-out/). The shape of the jet stream, with a trough over eastern Europe, helped transfer warm lower-latitude air to the north-central Siberian Arctic and adjacent marine areas to support these air temperature and sea-ice extremes (Fig. 3c).
Summer 2020. Summer air temperatures were especially warm for the Central Arctic Ocean, extending toward the Siberian Arctic (5°C above average; Fig. 2d). Warm anomalies over north-central Siberia were weaker relative to the previous winter and spring, though the strength of the warm anomaly rapidly increased toward the sector’s coastal areas extending into the Kara and Laptev Seas. A monthly mean air temperature record high was set in July at Svalbard Airport (9.8°C), which is 0.8°C above the previous record value from 2016 and 3.4°C above average. Ny-Ålesund also set a similar record in July (8°C), which is 0.7°C above the previous record value from 2019 and 2.7°C above normal. The trough-ridge jet stream pattern atop the Siberian coast (Fig. 3d) steered warm air off the continent into the Kara and Laptev Seas and contributed to sea-ice and sea surface temperature anomalies through the ice-albedo feedback (see essay Sea Surface Temperature).
References
Biskaborn, B. K., and Coauthors, 2019: Permafrost is warming at a global scale. Nat. Commun., 10, 264, https://doi.org/10.1038/s41467-018-08240-4.
Box, J. E., and Coauthors, 2019: Key indicators of Arctic climate change: 1971-2017. Environ. Res. Lett., 14, 045010, https://doi.org/10.1088/1748-9326/aafc1b.
Cohen, J., and Coauthors, 2020: Divergent consensuses on Arctic amplification influence on midlatitude severe winter weather. Nat. Climate Change, 10, 20-29, https://doi.org/10.1038/s41558-019-0662-y.
Hanna, E., and Coauthors, 2020: Mass balance of the ice sheets and glaciers – Progress since AR5 and challenges. Earth-Sci. Rev., 201, 102976, https://doi.org/10.1016/j.earscirev.2019.102976.
Jones, P. D., D. H. Lister, T. J. Osborn, C. Harpham, M. Salmon, and C. P. Morice, 2012: Hemispheric and large-scale land-surface air temperature variations: An extensive revision and an update to 2010. J. Geophys. Res., 117, D05127, https://doi.org/10.1029/2011JD017139.
Kalnay, E., and Coauthors, 1996: The NCEP/NCAR 40-year reanalysis project. Bull. Amer. Meteor. Soc., 77, 437-472, https://doi.org/10.1175/1520-0477(1996)077<0437:TNYRP>2.0.CO;2.
Myers-Smith, and Coauthors, 2020: Complexity revealed in the greening of the Arctic. Nat. Climate Change, 10, 106-117, https://doi.org/10.1038/s41558-019-0688-1.
Overland, J. E., and M. Wang, 2020: The 2020 Siberian heat wave. Int. J. Climatol., https://doi.org/10.1002/joc.6850.
Pithan, F., and T. Mauritsen, 2014: Arctic amplification dominated by temperature feedbacks in contemporary climate models. Nat. Geosci., 7, 181-184, https://doi.org/10.1038/NGEO2071.
Stroeve, J., and D. Notz, 2018: Changing state of Arctic sea ice across all seasons. Environ. Res. Lett., 13, 103001, https://doi.org/10.1088/1748-9326/aade56.
Thompson, D. W. J., and J. M. Wallace, 1998: The Arctic oscillation signature in the wintertime geopotential height and temperature fields. Geophys. Res. Lett., 25, 1297-1300, https://doi.org/10.1029/98GL00950.
December 18, 2020