
G. V. Frost1, U. S. Bhatt2, H. E. Epstein3, I. Myers-Smith4, G. K. Phoenix5, L. T. Berner6, J. W. Bjerke7, B. C. Forbes8, S. J. Goetz6, J. T. Kerby9, M. J. Macander1, T. Park10,11, M. K. Raynolds12, H. Tømmervik7, and D. A. Walker12
1Alaska Biological Research, Inc., Fairbanks, AK, USA
2Geophysical Institute, University of Alaska Fairbanks, Fairbanks, AK, USA
3Department of Environmental Sciences, University of Virginia, Charlottesville, VA, USA
4School of GeoSciences, University of Edinburgh, Edinburgh, UK
5Department of Animal and Plant Sciences, University of Sheffield, Sheffield, UK
6School of Informatics, Computing and Cyber Systems, Northern Arizona University, Flagstaff, AZ, USA
7Norwegian Institute for Nature Research, FRAM – High North Research Centre for Climate and the Environment, Tromsø, Norway
8Arctic Centre, University of Lapland, Rovaniemi, Finland
9Aarhus Institute of Advanced Studies, Aarhus University, Aarhus, Denmark
10Ames Research Center, NASA, Mountain View, CA, USA
11Bay Area Environmental Research Institute, Moffett Field, Mountain View, CA, USA
12Institute of Arctic Biology, University of Alaska Fairbanks, Fairbanks, AK, USA
Highlights
- In North America, tundra productivity for the 2019 growing season (the most recent data available) rebounded strongly from the previous year, in tandem with record summer warmth following the cold summer of 2018.
- Since 2016, greenness trends have diverged strongly by continent; peak summer greenness has declined sharply in North America but has remained above the long-term mean in Eurasia.
- The long-term satellite record (1982-2019) indicates “greening” across most of the Arctic but some regions exhibit “browning,” underscoring the dynamic linkages that exist between tundra ecosystems and other elements of a changing Arctic system.
The Arctic tundra biome occupies Earth’s northernmost landmasses and forms a “wreath” of treeless vegetation that encircles the Arctic Ocean. Arctic tundra ecosystems are strongly influenced by warming air temperatures (Bjorkman et al. 2020), and thus have become a focal point of global environmental change. One of the most conspicuous impacts of a warming Arctic climate and declining sea ice has been an increase in the productivity, or “greenness” of tundra vegetation (Lawrence et al. 2008; Bhatt et al. 2010; see essays Surface Air Temperature and Sea Ice). Tundra greenness has been monitored by Earth-observing satellites since the early 1980s and was identified as a key vital sign of the Arctic in the first Arctic Report Card published in 2006 (Richter-Menge et al. 2006). Satellites continue to monitor tundra greenness to the present day, although at the time of writing the record is only available through the 2019 growing season due to data processing requirements. Arctic greening has continued but interannual variability in greenness has increased over the past decade and trends have not been uniform from place to place or from year to year (Bhatt et al. 2013; National Academies of Sciences, Engineering and Medicine 2019; Myers-Smith et al. 2020). This interannual variability results from the dynamic linkages that connect the vegetation, atmosphere, sea ice, permafrost, seasonal snow, soils, disturbance processes, and wildlife of the Arctic (Duncan et al. 2020).
The combination of gradual and abrupt changes occurring in Arctic landscapes have consequences that extend beyond other elements of the Arctic environment, to the global atmosphere and climate system (Post et al. 2019). Changes in the species composition, height, and biomass of tundra vegetation impact the biogeochemical cycling of carbon and nutrients in Arctic soils (Hewitt et al. 2019; Natali et al. 2019; Turetsky et al. 2019; Hugelius et al. 2020), as well as the distribution of snow on the landscape, the timing of spring snowmelt, and the exchange of energy between Earth’s atmosphere and permafrost (Wilcox et al. 2019; Grünberg et al. 2020). Permafrost thaw can dramatically affect vegetation, as well as surface topography, geomorphology, and surface wetness (Farquharson et al. 2019; Turetsky et al. 2020), which can further amplify changes to wildlife habitats (Kwon et al. 2019; Andruko et al. 2020; Skarin et al. 2020) and the availability of subsistence resources that are vital to the economy and food security of Arctic peoples (Bronen et al. 2020; Herman-Mercer et al. 2020).
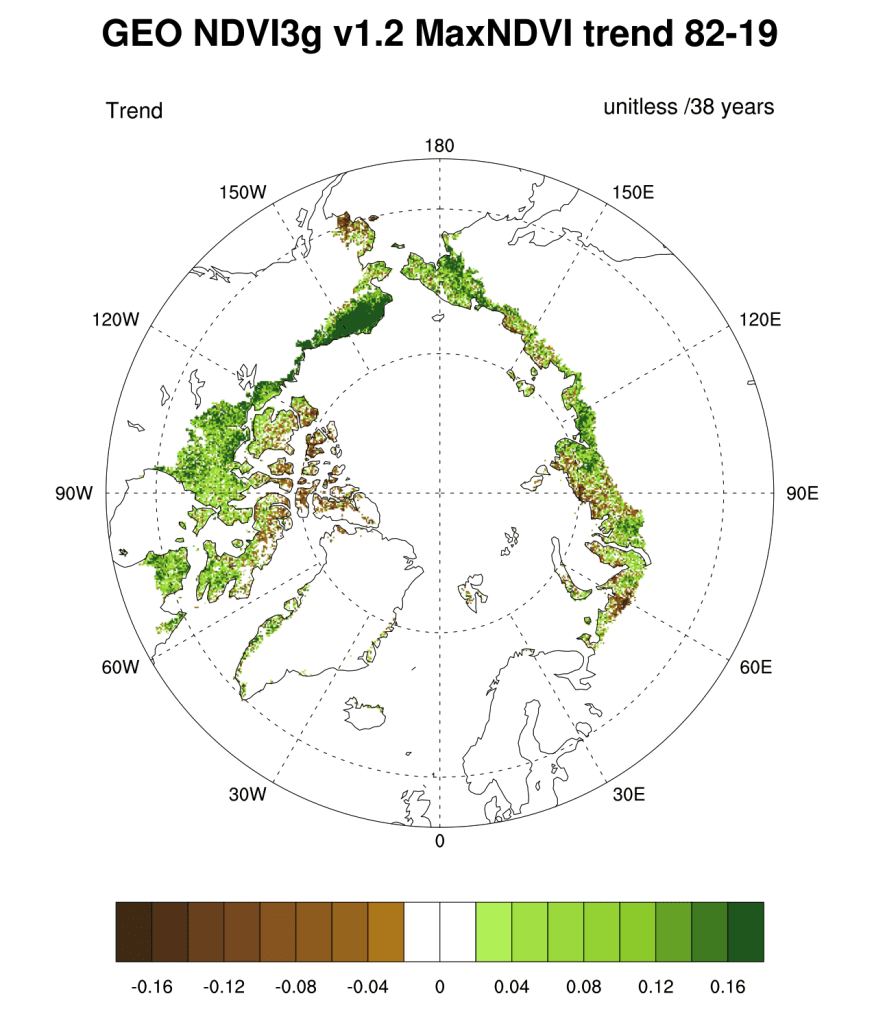
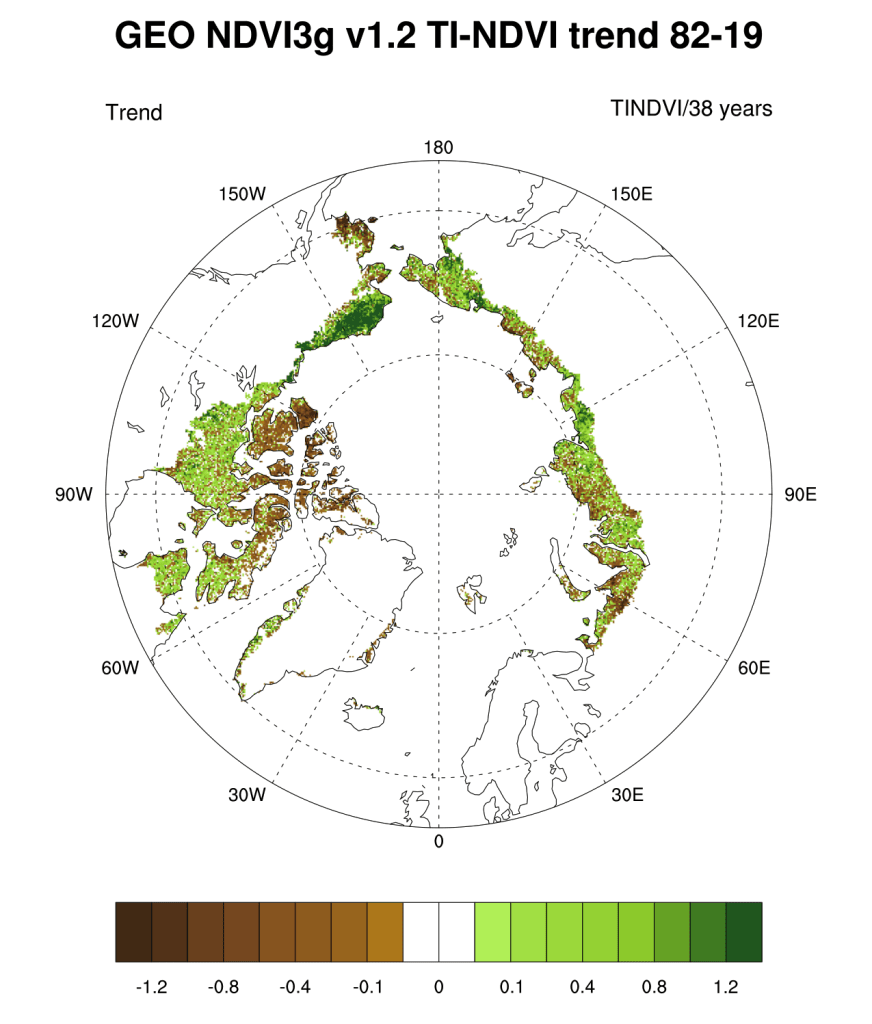
In late 1981, NOAA Earth-observing satellites began acquiring daily “snapshots” of global vegetation productivity using the Advanced Very High Resolution Radiometer (AVHRR). This dataset has continued through the 2019 Arctic growing season. Satellite observations of tundra productivity use a spectral index termed the Normalized Difference Vegetation Index (NDVI), which is sensitive to the unique way in which green vegetation reflects light in the Red and Near-Infrared wavelengths. NDVI values are strongly correlated with the quantity of aboveground vegetation, or “greenness,” of Arctic tundra (Raynolds et al. 2012). The dataset reported here is the Global Inventory Modeling and Mapping Studies 3g V1.2 dataset (GIMMS-3g+), which is based upon corrected and calibrated AVHRR data. GIMMS-3g+ consists of a global composite of the maximum NDVI value observed every 15-16 days within 1/12° grid cells, or “pixels” (Pinzon and Tucker 2014). We use two metrics based on GIMMS-3g+. MaxNDVI is the peak NDVI value for the calendar year and corresponds to maximum aboveground live biomass during the Arctic summer, typically recorded in late July or early August. TI-NDVI is the time-integrated NDVI, calculated as the sum of all biweekly NDVI values >0.05 (i.e., collected during the growing season) and is correlated with the total aboveground vegetation productivity over the summer. Average NDVI values for North American tundra are lower than in Eurasia because a large proportion of the North American Arctic lies in the very cold, dry High Arctic and a comparatively shorter period of time has been available for soils development after Pleistocene glaciation in this region (Walker et al. 2005).
The GIMMS-3g+ record indicates both MaxNDVI and TI-NDVI have increased across most of the Arctic over the last 38 years (1982-2019) (Figs. 1a,b). There is strong regional variability in trends, however, with areas of strong greening on Alaska’s North Slope, the Low Arctic of mainland Canada, and the Chukotka Peninsula in far eastern Russia. Tundra greenness appears to be declining (“browning”), however, in southwestern Alaska, the Canadian Arctic Archipelago, and northwestern Siberia. Regional “hotspots” of trend are generally consistent between the two NDVI metrics, but the declines in TI-NDVI tend to be more pronounced than for MaxNDVI.
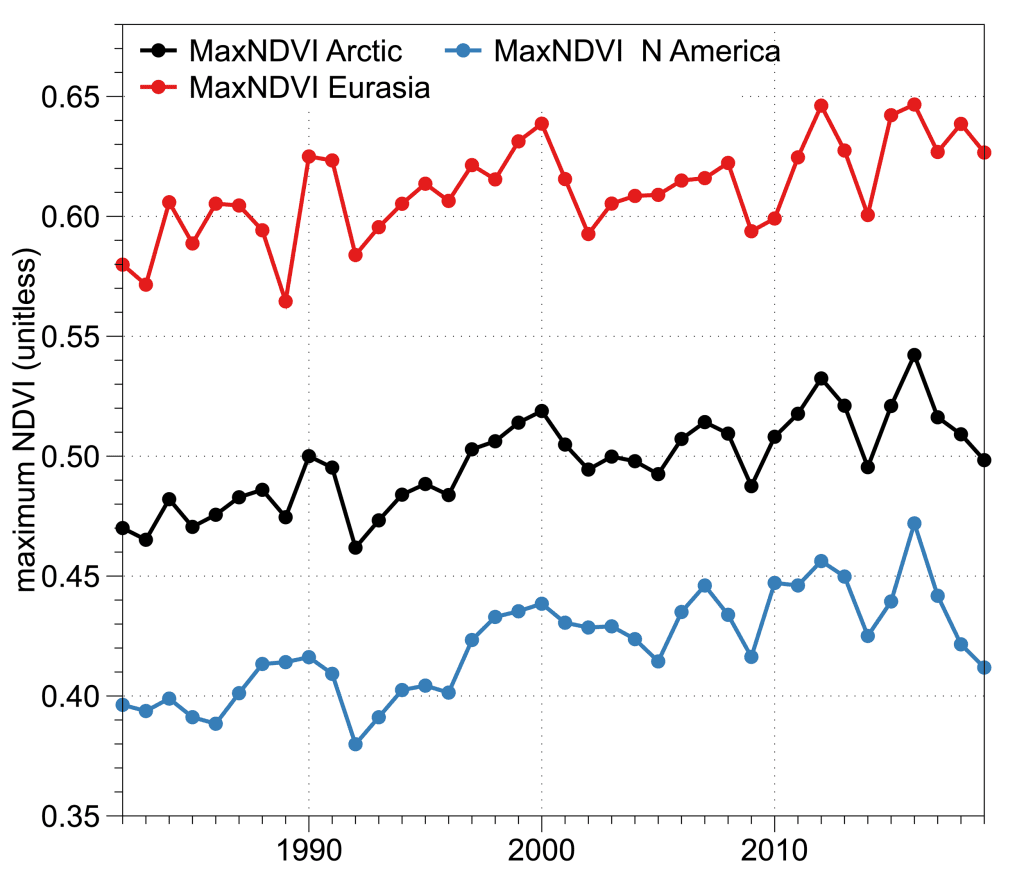
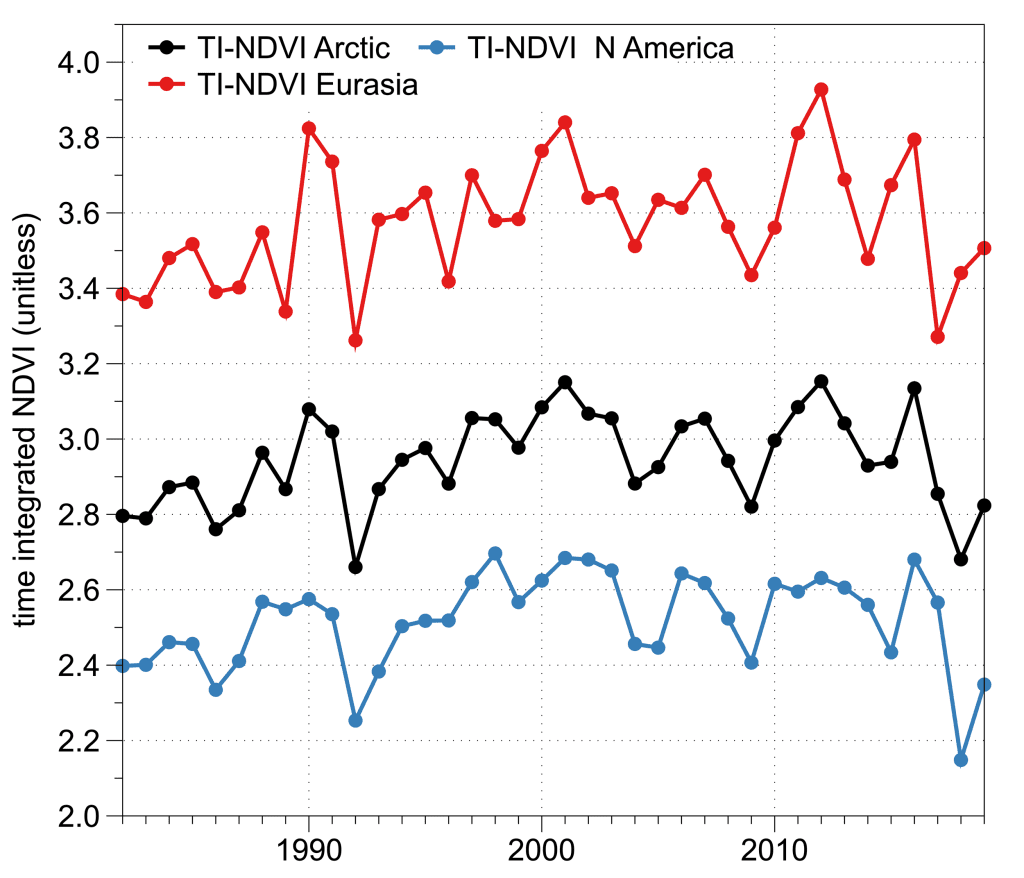
In 2019, the mean MaxNDVI value for the circumpolar Arctic declined 2% from the previous year (Fig. 2a), marking the third straight year of MaxNDVI decline after the record high value set in 2016. Over the last 3 years, there have been striking contrasts in MaxNDVI variability by continent. In the Eurasian Arctic, the 2019 value was similar to the preceding four years, being 3% higher than the 1982-2019 mean. In the North American Arctic, however, the 2019 MaxNDVI value was the lowest in the record since 1996 and was 2% below the long-term mean. In contrast to MaxNDVI, there was a 5% increase in circumpolar mean TI-NDVI from the previous year (Fig. 2b). This increase was particularly strong in the North American Arctic, where TI-NDVI rebounded after the unusually slow growing season of 2018 associated with relatively cold summer temperatures (Overland et al. 2018). The 2019 TI-NDVI marked the third largest single-year increase (9%) in the entire record for North America. Nonetheless, the 2019 TI-NDVI for the circumpolar region was 4% lower than the 1982-2019 mean, marking the second lowest value since 1993.
The AVHRR sensors that record NDVI also record Land Surface Temperature (LST), a key control of tundra productivity that provides context for understanding spatio-temporal patterns of tundra greenness and phenology (Arndt et al. 2019; Park et al. 2019; Xu et al. 2019, 2020). A useful metric of growing conditions is the Summer Warmth Index (SWI), the sum of mean monthly LST values for months with mean temperatures above freezing, expressed as °C-months. The 2019 growing season was the warmest in the entire record for both continents; the mean SWI for the full circumpolar region (39.0°C-months) broke the previous record (34.9°C-months in 2016; Overland et al. 2019). In the North American Arctic, record warmth was especially noteworthy because summer temperatures averaged well below normal in the previous year. Interestingly, the record warmth in the North American Arctic was not accompanied by strong increases in MaxNDVI in 2019, possibly due to lag effects arising from cold conditions a year earlier.
Greening dominates trends in Arctic NDVI since 1982. Many site-specific studies have detected an associated increase in the abundance of taller plants, particularly tundra shrubs (Bjorkman et al. 2018; Andreu-Hayles et al. 2020, Shevtsova et al. 2020; Thomas et al. 2020). However, greening is not happening everywhere. Over the past 15 years, browning—a reduction in plant biomass that can occur as a trend over decadal timescales, or as an abrupt, extreme event within a year—has emerged as an increasingly important phenomenon (Phoenix and Bjerke 2016) that is now contributing to greater complexity of Arctic vegetation trends (Myers-Smith et al. 2020). Browning trends can arise from reduced summer warmth or prolonged winter snow cover that reduce productivity (Bieniek et al. 2015; Cao et al. 2020). Episodic events can also cause die-back or removal of vegetation, including wildfire (Rocha and Shaver 2011; Frost et al. 2020; see essay Wildland Fire), permafrost thaw (Turetsky et al. 2020; Verdonen et al. 2020), abrupt temperature changes or extreme weather events (Bokhorst et al. 2009), and herbivore and pest outbreaks (Lund et al. 2017; Prendin et al. 2020). Severe event-driven browning led to major reductions in ecosystem CO2 fluxes in the European Arctic (Treharne et al. 2020). While Arctic warming is likely to continue to drive greening, drivers of browning are also increasing in frequency (Hu et al. 2015; Vikhamar-Schuler et al. 2016; Wu et al. 2020), highlighting the emergence of increased variability as a component of Arctic climate change.
GIMMS-3g+ is a legacy dataset that provides by far the longest continuous record for the entire Arctic of any spaceborne record. However, MaxNDVI datasets compiled from more recent satellites with higher spatial resolution can be used to corroborate the GIMMS-3g+ record and provide context for understanding what the NDVI changes represent on the ground. Estimates of the proportion of statistically significant NDVI trends vary with 42% greening and 3% browning during 1982-2014 in GIMMS-3g+ (Park et al. 2016), to 20% greening and 4% browning during 2000-2016 in 30 m resolution Landsat data (Berner et al. 2020), and 13% greening and 1% browning during 2000-2018 for 250 m resolution Moderate Resolution Imaging Spectroradiometer (MODIS) data (Myers-Smith et al. 2020). The different spatial resolutions and durations of satellite time-series make direct comparisons difficult, but the picture that emerges from spaceborne datasets is that of an overall greener Arctic (Beamish et al. 2020; Myers-Smith et al. 2020). A rapidly growing area of Arctic greening research is the incorporation of new types of high-resolution data collection to bridge scale gaps between satellite observations and ground-based ecological monitoring (Cunliffe et al. 2020; Siewert and Olofsson 2020; Yang et al. 2020; Assmann et al. 2020). Airborne and drone data collection campaigns in recent years are also shedding new light on Arctic greening (Miller et al. 2019). Continued monitoring of Arctic landscapes from space and field studies improves our understanding of Arctic environmental change and its implications in Earth’s northernmost lands and beyond.
References
Andreu-Hayles, L., B. V. Gaglioti, L. T. Berner, M. Levesque, K. J. Anchukaitis, S. J. Goetz, and R. D’Arrigo, 2020: A narrow window of summer temperatures associated with shrub growth in Arctic Alaska. Environ. Res. Lett., 15, 105012, https://doi.org/10.1088/1748-9326/ab897f.
Andruko, R., R. Danby, and P. Grogan, 2020: Recent growth and expansion of birch shrubs across a Low Arctic landscape in continental Canada: Are these responses more a consequence of the severely declining caribou herd than of climate warming? Ecosystems, 23, 1362-1379, https://doi.org/10.1007/s10021-019-00474-7.
Arndt, K. A., and Coauthors, 2019: Arctic greening associated with lengthening growing seasons in Northern Alaska. Environ. Res. Lett., 14, 125018, https://doi.org/10.1088/1748-9326/ab5e26.
Assmann, J. J., I. Myers-Smith, J. Kerby, A. M. Cunliffe, and G. N. Daskalova, 2020: Drone data reveal heterogeneity in tundra greenness and phenology not captured by satellites. Environ. Res. Lett., 15, 125002, https://doi.org/10.1088/1748-9326/abbf7d.
Beamish, A., and Coauthors, 2020: Recent trends and remaining challenges for optical remote sensing of Arctic tundra vegetation: A review and outlook. Remote Sens. Environ., 246, 111872, https://doi.org/10.1016/j.rse.2020.111872.
Berner, L. T., and Coauthors, 2020: Summer warming explains widespread but not uniform greening in the Arctic tundra biome. Nat. Commun., 11, 4621, https://doi.org/10.1038/s41467-020-18479-5.
Bhatt, U., and Coauthors, 2010: Circumpolar Arctic tundra vegetation change linked to sea ice decline. Earth Interact., 14, 1-20, https://doi.org/10.1175/2010EI315.1.
Bhatt, U., and Coauthors, 2013: Recent declines in warming and vegetation greening trends over Pan-Arctic tundra. Remote Sens., 5, 4229-4254, https://doi.org/10.3390/rs5094229.
Bieniek, P. A., and Coauthors, 2015: Climate drivers linked to changing seasonality of Alaska coastal tundra vegetation productivity. Earth Interact., 19, 1-29, https://doi.org/10.1175/EI-D-15-0013.1.
Bjorkman, A. D., and Coauthors, 2018: Plant functional trait change across a warming tundra biome. Nature, 562, 57-62, https://doi.org/10.1038/s41586-018-0563-7.
Bjorkman, A. D., and Coauthors, 2020: Status and trends in Arctic vegetation: Evidence from experimental warming and long-term monitoring. Ambio, 49, 678-692, https://doi.org/10.1007/s13280-019-01161-6.
Bokhorst, S. F., J. W. Bjerke, H. Tømmervik, T. V. Callaghan, and G. K. Phoenix, 2009: Winter warming events damage sub-Arctic vegetation: consistent evidence from an experimental manipulation and a natural event. J. Ecol., 97, 1408-1415, https://doi.org/10.1111/j.1365-2745.2009.01554.x.
Bronen, R., D. Pollock, J. Overbeck, D. Stevens, S. Natali, and C. Maio, 2020: Usteq: integrating indigenous knowledge and social and physical sciences to coproduce knowledge and support community-based adaptation. Polar Geogr., 43, 188-205, https://doi.org/10.1080/1088937X.2019.1679271.
Cao, R., Y. Feng, X. Liu, M. Shen, and J. Zhou, 2020: Uncertainty of vegetation green-up date estimated from vegetation indices due to snowmelt at northern middle and high latitudes. Remote Sens., 12, 190, https://doi.org/10.3390/rs12010190.
Cunliffe, A. M., J. J. Assmann, G. Daskalova, J. T. Kerby, and I. H. Myers-Smith: Aboveground biomass corresponds strongly with drone-derived canopy height but weakly with greenness (NDVI) in a shrub tundra landscape. Environ. Res. Lett., 15(12), 125004, https://doi.org/10.1088/1748-9326/aba470.
Duncan, B. N., and Coauthors, 2020: Space-based observations for understanding changes in the Arctic-boreal zone. Rev. Geophys., 58, e2019RG000652, https://doi.org/10.1029/2019RG000652.
Farquharson, L. M., V. E. Romanovsky, W. L. Cable, D. A. Walker, S. V. Kokelj, and D. Nicolsky, 2019: Climate change drives widespread and rapid thermokarst development in very cold permafrost in the Canadian High Arctic. Geophys. Res. Lett., 46, 6681-6689, https://doi.org/10.1029/2019GL082187.
Frost, G. V., R. A. Loehman, L. B. Saperstein, M. J. Macander, P. R. Nelson, D. P. Paradis, and S. M. Natali, 2020: Multi-decadal patterns of vegetation succession after tundra fire on the Yukon-Kuskokwim Delta, Alaska. Environ. Res. Lett., 15, 025003, https://doi.org/10.1088/1748-9326/ab5f49.
Grünberg, I., E. J. Wilcox, S. Zwieback, P. Marsh, and J. Boike, 2020: Linking tundra vegetation, snow, soil temperature, and permafrost. Biogeosciences, 17, 4261-4279, https://doi.org/10.5194/bg-17-4261-2020.
Herman-Mercer, N. M., R. A. Loehman, R. C. Toohey, and C. Paniyak, 2020: Climate- and disturbance-driven changes in subsistence berries in coastal Alaska: Indigenous knowledge to inform ecological inference. Hum. Ecol., 48, 85-99, https://doi.org/10.1007/s10745-020-00138-4.
Hewitt, R. E., D. L. Taylor, H. Genet, A. D. McGuire, and M. C. Mack, 2019: Below-ground plant traits influence tundra plant acquisition of newly thawed permafrost nitrogen. J. Ecol., 107, 950-962, https://doi.org/10.1111/1365-2745.13062.
Hu, F. S., P. E. Higuera, P. Duffy, M. L. Chipman, A. V. Rocha, A. M. Young, R. Kelly, and M. C. Dietze, 2015: Arctic tundra fires: natural variability and responses to climate change. Front. Ecol. Environ., 13, 369-377, https://doi.org/10.1890/150063.
Hugelius, G., and Coauthors, 2020: Large stocks of peatland carbon and nitrogen are vulnerable to permafrost thaw. P. Natl. A. Sci., 117, 20438-20446, https://doi.org/10.1073/pnas.1916387117.
Kwon, E., and Coauthors, 2019: Geographic variation in the intensity of warming and phenological mismatch between Arctic shorebirds and invertebrates. Ecol. Monogr., 89, e01383, https://doi.org/10.1002/ecm.1383.
Lawrence, D. M., A. G. Slater, R. A. Tomas, M. M. Holland, and C. Deser, 2008: Accelerated Arctic land warming and permafrost degradation during rapid sea ice loss. Geophys. Res. Lett., 35, L11506, https://doi.org/10.1029/2008GL033985.
Lund, M., K. Raundrup, A. Westergaard-Nielsen, E. López-Blanco, J. Nymand, and P. Aastrup, 2017: Larval outbreaks in West Greenland: Instant and subsequent effects on tundra ecosystem productivity and CO2 exchange. Ambio, 46, 26-38, https://doi.org/10.1007/s13280-016-0863-9.
Miller, C. E., and Coauthors, 2019: An overview of ABoVE airborne campaign data acquisitions and science opportunities. Environ. Res. Lett., 14, 080201, https://doi.org/10.1088/1748-9326/ab0d44.
Myers-Smith, I. H., and Coauthors, 2020: Complexity revealed in the greening of the Arctic. Nat. Climate Change, 10, 106-117, https://doi.org/10.1038/s41558-019-0688-1.
Natali, S. M., and Coauthors, 2019: Large loss of CO2 in winter observed across the northern permafrost region. Nat. Climate Change, 9, 852-857, https://doi.org/10.1038/s41558-019-0592-8.
National Academies of Sciences, Engineering and Medicine, 2019: Understanding northern latitude vegetation greening and browning: proceedings of a workshop, A. Melvin, Ed. The National Academies Press.
Overland, J. E., E. Hanna, I. Hanssen-Bauer, S. -J. Kim, J. E. Walsh, M. Wang, U. S. Bhatt, and R. L. Thoman, 2018: Surface Air Temperature. Arctic Report Card 2018, E. Osborne, J. Richter-Menge, and M. Jeffries, Eds., https://www.arctic.noaa.gov/Report-Card.
Overland, J. E., E. Hanna, I. Hanssen-Bauer, S. -J. Kim, J. E. Walsh, M. Wang, U. S. Bhatt, R. L. Thoman, and T. J. Ballinger, 2019: Surface Air Temperature. Arctic Report Card 2019, J. Richter-Menge, M. L. Druckenmiller, and M. Jeffries, Eds., http://www.arctic.noaa.gov/Report-Card.
Park, T., and Coauthors, 2016: Changes in growing season duration and productivity of northern vegetation inferred from long-term remote sensing data. Environ. Res. Lett., 11, 084001, https://doi.org/10.1088/1748-9326/11/8/084001.
Park, T., and Coauthors, 2019: Changes in timing of seasonal peak photosynthetic activity in northern ecosystems. Glob. Change Biol., 25, 2382-2395, https://doi.org/10.1111/gcb.14638.
Phoenix, G. K., and J. W. Bjerke, 2016: Arctic browning: extreme events and trends reversing arctic greening. Glob. Change Biol., 22, 2960-2962, https://doi.org/10.1111/gcb.13261.
Pinzon, J. E., and C. J. Tucker, 2014: A non-stationary 1981-2012 AVHRR NDVI3g time series. Remote Sens., 6, 6929-6960, https://doi.org/10.3390/rs6086929.
Post, E., and Coauthors, 2019: The polar regions in a 2°C warmer world. Sci. Advances, 5, eaaw9883, https://doi.org/10.1126/sciadv.aaw9883.
Prendin, A. L., and Coauthors, 2020: Immediate and carry-over effects of insect outbreaks on vegetation growth in West Greenland assessed from cells to satellite. J. Biogeogr., 47, 87-100, https://doi.org/10.1111/jbi.13644.
Raynolds, M. K., D. A. Walker, H. E. Epstein, J. E. Pinzon, and C. J. Tucker, 2012: A new estimate of tundra-biome phytomass from trans-Arctic field data and AVHRR NDVI. Remote Sens. Lett., 3, 403-411, https://doi.org/10.1080/01431161.2011.609188.
Richter-Menge, J., and Coauthors, 2006: State of the Arctic Report. NOAA/OAR/PMEL, https://www.arctic.noaa.gov/Report-Card/Report-Card-Archive.
Rocha, A. V., and G. R. Shaver, 2011: Postfire energy exchange in arctic tundra: the importance and climatic implications of burn severity. Glob. Change Biol., 17, 2831-2841, https://doi.org/10.1111/j.1365-2486.2011.02441.x.
Shevtsova, I., B. Heim, S. Kruse, J. Schröder, E. I. Troeva, L. A. Pestryakova, E. S. Zakharov, and U. Herzschuh, 2020: Strong shrub expansion in tundra-taiga, tree infilling in taiga and stable tundra in central Chukotka (north-eastern Siberia) between 2000 and 2017. Environ. Res. Lett., 15, 085006, https://doi.org/10.1088/1748-9326/ab9059.
Siewert, M. B., and J. Olofsson, 2020: Scale-dependency of Arctic ecosystem properties revealed by UAV. Environ. Res. Lett., 15, 094030, https://doi.org/10.1088/1748-9326/aba20b.
Skarin, A., M. Verdonen, T. Kumpula, M. Macias-Fauria, M. Alam, J. T. Kerby, and B. C. Forbes, 2020: Reindeer use of low Arctic tundra correlates with landscape structure. Environ. Res. Lett., 15, 115012, https://doi.org/10.1088/1748-9326/abbf15.
Thomas, H. J. D., and Coauthors, 2020: Global plant trait relationships extend to the climatic extremes of the tundra biome. Nat. Commun., 11, 1351, https://doi.org/10.1038/s41467-020-15014-4.
Treharne, R., J. W. Bjerke, H. Tømmervik, and G. K. Phoenix, 2020: Extreme event impacts on CO2 fluxes across a range of high latitude, shrub-dominated ecosystems. Environ. Res. Lett., 15, 104084, https://doi.org/10.1088/1748-9326/abb0b1.
Turetsky, M. R., and Coauthors, 2019: Permafrost collapse is accelerating carbon release. Nature, 569, 32-34, https://doi.org/10.1038/d41586-019-01313-4.
Turetsky, M. R., and Coauthors, 2020: Carbon release through abrupt permafrost thaw. Nat. Geosci., 13, 138-143, https://doi.org/10.1038/s41561-019-0526-0.
Verdonen, M., L. T. Berner, B. C. Forbes, and T. Kumpula, 2020: Periglacial vegetation dynamics in Arctic Russia: decadal analysis of tundra regeneration on landslides with time series satellite imagery. Environ. Res. Lett., 15, 105020, https://doi.org/10.1088/1748-9326/abb500.
Vikhamar-Schuler, D., K. Isaksen, J. E. Haugen, H. Tømmervik, B. Luks, T. V. Schuler, and J. W. Bjerke, 2016: Changes in winter warming events in the Nordic arctic region. J. Climate, 29, 6223-6244, https://doi.org/10.1175/JCLI-D-15-0763.1.
Walker, D. A., and Coauthors, 2005: The circumpolar Arctic vegetation map. J. Veg. Sci., 16, 267-282.
Wilcox, E. J., D. Keim, T. de Jong, B. Walker, O. Sonnentag, A. E. Sniderhan, P. Mann, and P. Marsh, 2019: Tundra shrub expansion may amplify permafrost thaw by advancing snowmelt timing. Arctic Sci., 5, 202-217, https://doi.org/10.1139/as-2018-0028.
Wu, W., X. Sun, H. Epstein, X. Xu, and X. Li, 2020: Spatial heterogeneity of climate variation and vegetation response for Arctic and high-elevation regions from 2001-2018. Environ. Res. Commun., 2, 011007, https://doi.org/10.1088/2515-7620/ab6369.
Xu, X., W. J. Riley, C. D. Koven, and G. Jia, 2019: Heterogeneous spring phenology shifts affected by climate: supportive evidence from two remotely sensed vegetation indices. Environ. Res. Commun., 1, 091004, https://doi.org/10.1088/2515-7620/ab3d79.
Xu, X., W. J. Riley, C. D. Koven, G. Jia, and X. Zhang, 2020: Earlier leaf-out warms air in the north. Nat. Climate Change, 10, 370-375, https://doi.org/10.1038/s41558-020-0713-4.
Yang, D., and Coauthors, 2020: A multi-sensor Unoccupied Aerial System improves characterization of vegetation composition and canopy properties in the Arctic tundra. Remote Sens., 12, 2638, https://doi.org/10.3390/rs12162638.
December 9, 2020