
T. A. Moon1,2, M. Tedesco3,4, J. E. Box5, J. Cappelen6, R. S. Fausto5, X. Fettweis7, N. J. Korsgaard5, B. Loomis8, K. D. Mankoff5, T. Mote9, C. H. Reijmer10, C. J. P. P. Smeets11, D. van As5, and R. S. W. van de Wal10,11
1Cooperative Institute for Research in Environmental Sciences, University of Colorado Boulder, Boulder, CO, USA
2National Snow and Ice Data Center, Boulder, CO, USA
3Lamont Doherty Earth Observatory of Columbia University, Palisades, NY, USA
4Goddard Institute of Space Studies, NASA, New York, NY, USA
5Geological Survey of Denmark and Greenland, Copenhagen, Denmark
6Danish Meteorological Institute, Copenhagen, Denmark
7University of Liege, Liege, Belgium
8Goddard Space Flight Center, NASA, Greenbelt, MD, USA
9Department of Geography, University of Georgia, Athens, GA, USA
10Institute for Marine and Atmospheric Research Utrecht, Utrecht University, Utrecht, The Netherlands
11Department of Physical Geography, Utrecht University, Utrecht, The Netherlands
Highlights
- During September 2019-August 2020 the Greenland ice sheet experienced ice loss that was higher than the 1981-2010 average but substantially lower than the record 2018/19 losses.
- Abnormal cyclonic atmospheric circulation centered over Greenland promoted normal or colder-than-average conditions for the interior and east, with higher air temperatures in the north, southwest, and many coastal regions.
- Albedo during summer 2020 was above average at the ice-sheet-wide scale, with below average albedo in the north and south but above average in the central and interior regions, mostly aligning with temperature anomalies.
Introduction
The Greenland ice sheet sits atop the world’s largest island and holds the equivalent of 7.4 m of potential sea level rise (Morlighem et al. 2017). Following a period of relative stability from the 1970s to early 1990s, the ice sheet began losing ice at an accelerating rate and has now experienced annual net ice loss every year since 1998 (Mouginot et al. 2019). The largest annual mass losses since regular monitoring began in the 1950s occurred in 2012 and 2019, with losses of -464 ± 62 Gt and -532 ± 58 Gt, respectively (Sasgen et al. 2020; estimates including all Greenland glaciers and peripheral ice caps and excluding Ellesmere Island). The record ice loss in 2019 is equivalent to ~1.5 mm global sea level rise. Total ice loss in 2020 (-293 ± 66 Gt) is substantially less than these record years, in part due to cooler summer surface air temperatures and relatively bright surface conditions in the central regions. Overall, the number of melt days was slightly above average but with large regional variation.
To capture the annual cycle of accumulation (ice gain) and ablation (ice loss), Greenland measurements are commonly synthesized from September through August. Hence, the seasons in this essay are delineated as autumn (September through November, SON), winter (December through February, DJF), spring (March through May, MAM), and summer (June through August, JJA).
Atmospheric conditions and surface air temperature
Atmospheric circulation anomalies over Greenland during summer 2020 created strong regional differences in surface air temperatures. Abnormal cyclonic circulation promoted near-to-below-average air temperatures in the interior and east. Warmer-than-average conditions, however, impacted the southern, northern, and most coastal regions (see Fig. 2 in essay Surface Air Temperature). The summer 2020 circulation anomaly pattern was the opposite to that of 2019, helping to facilitate more moderate Greenland ice loss.
The high regional variability was evident at in situ measurement sites. Measurements at 20 Danish Meteorological Institute (DMI) weather stations reported near-to-above-average temperatures compared to the 1981-2010 mean, with the exception of winter 2019-2020, when temperatures were near to below average at almost all DMI stations. Measurements at 8 weather station transects of the Programme for Monitoring of the Greenland Ice Sheet (PROMICE) indicate average summer (JJA) temperatures at the ice sheet margin relative to the 1981-2010 period, except at stations KPC_L (+0.6 ± 0.3°C anomaly), SCO_L (+0.6 ± 0.4°C), KAN_L (+0.5 ± 0.4°C), and THU_L (+1.2 ± 0.4°C) (Fausto and van As 2019; transect locations in Fig. 3). In the ice sheet interior, Summit Station observations show near to slightly above normal temperatures for autumn 2019, spring 2020, and summer 2020, while winter 2019/20 was significantly colder than average.
Albedo
Ice sheet albedo is also important for influencing surface melt. Albedo, which is the fraction of surface sunlight reflected, is dependent on ice sheet surface conditions. A high albedo means more sunlight is reflected (bright), while a low albedo leads to greater sunlight absorption (dark). During the summer season, absorbed sunlight is the dominant energy source for snow and ice melt in the Greenland ablation area (the peripheral region across which all winter snow is melted away during the following summer) (van den Broeke et al. 2011). Estimated via the MODIS satellite (Moderate Resolution Imaging Spectroradiometer; after Box et al. 2017), the 2020 summer ice-sheet-wide albedo (80.8%) was near the 2000-2020 average (79.1%) (Fig. 1b), with dark anomalies in the south and north and bright anomalies across the mid-section (Fig. 1a).

Surface melting
Daily satellite observations from the Special Sensor Microwave Imager/Sounder (SSMIS) passive microwave radiometer allow estimates of surface melt spatial extent and duration (e.g., Mote 2007; Tedesco et al. 2013). Estimates of the daily melt extent across the Greenland ice sheet exceeded the 1981-2010 median (i.e., conditions were warmer) on more than half of the days during summer 2020 (Fig. 2a). The maximum daily extent reached 33.8% of the ice sheet surface on 10 July, lower than the average maximum extent (1981-2010) of 39.8% (Fig. 2a), though the cumulative melt-day extent for 2020 was 29.2% higher (18.6 million km2) than the 1981-2010 average (14.4 million km2).
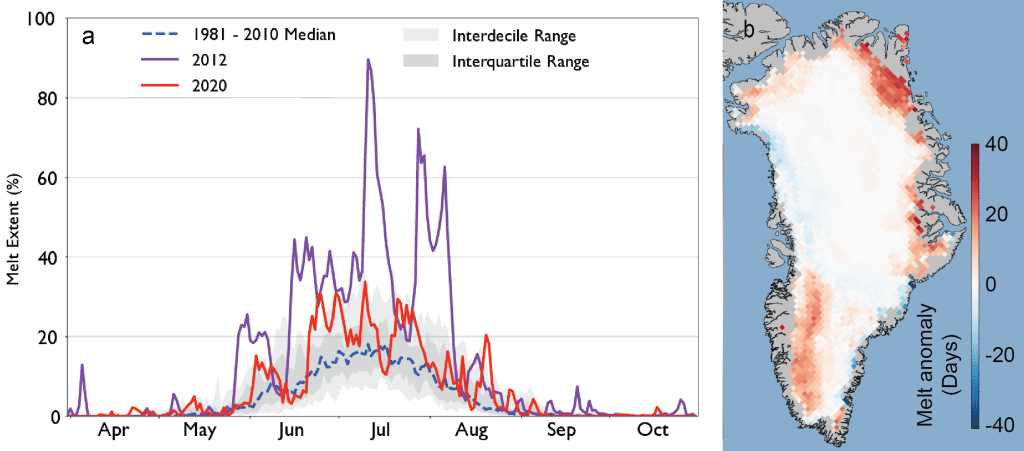
Compared to previous summers, melt duration exceeded the mean for most of the southwest and northeast ablation zone. The northeastern periphery of the ice sheet had more than 30 additional days with melt compared to the mean (Fig. 2b). However, in much of the accumulation zone and the west central periphery of the ice sheet, melt duration was below the 1981-2010 mean (Fig. 2b). This region broadly corresponds to a region of positive albedo anomalies (Fig. 1b) and the patterns are also consistent with surface air temperature anomalies (see essay Surface Air Temperature). Discrepancies between the melt duration and ablation anomalies, which can result from summer snowfall, occurred in the east central periphery of the ice sheet.
Surface mass balance
Along with meteorology, the PROMICE weather stations record surface mass balance including ice ablation along the ice sheet perimeter. Referencing values to the 1981-2010 mean following van As et al. (2016), 2020 ablation anomalies at 5 out of 8 sites along the ice sheet margin were near average, within uncertainty. At stations KPC_L (northeast), KAN_L (southwest), and THU_L (northwest) ablation was above average with positive anomaly values of 33 ± 29%, 22 ± 20%, and 66 ± 49%, respectively (Fig. 3). For the 30-year measurement record (1990-2020) available from the K-transect (67° N) in the southwestern ablation zone (region indicated in Fig. 1a), summer 2020 ablation was close to the measurement period mean.

Ice discharge and glaciers
Along with surface ice melt, the Greenland ice sheet loses mass via calving of icebergs from glaciers in contact with the ocean (solid ice discharge). PROMICE combines ice thickness estimates with ice velocity measurements based on Sentinel-1 satellite data to create a high temporal resolution solid ice discharge product integrated over Greenland (following Mankoff et al. 2020). For 1981-2010, the average total discharge was ~460 ± 46 Gt yr-1, while average discharge during 2010-2019 was ~487 ± 49 Gt yr-1. As of 21 October 2020, solid ice discharge for 2020 reached an average of 506 ± 50 Gt yr-1, with the largest contributions from the southeast, following by the northwest (see Fig. 1a for regions). Discharge from the central east is slightly greater than from the central west, with the smallest contributions from the northeast, north, and southwest.
If solid ice discharge is more rapid than replacement of glacier ice from ice flow, the glacier front or ice edge will retreat and glacier area is lost. The 2019/20 end-of-melt-season area changes for 47 Greenland tidewater glacier fronts (selected to provide regional coverage and include major glaciers) show a net area loss of 55.4 km2, compared to an average yearly loss of 99.5 km2 for these glaciers since 1999 (Fig. 4a). Of the 47 glaciers measured during 2019/20 (Fig. 4b), 20 retreated, 12 advanced, and 15 were stable (within ±0.2 km2), contrasting somewhat with the higher area loss during 2018/19 in which only six glaciers advanced, 29 retreated, and 12 were stable. (Note: Ice loss values are derived following Andersen et al. (2019) using Landsat, Aster, and, since 2015, exclusively Sentinel-2 optical satellite imagery.)

Total mass balance
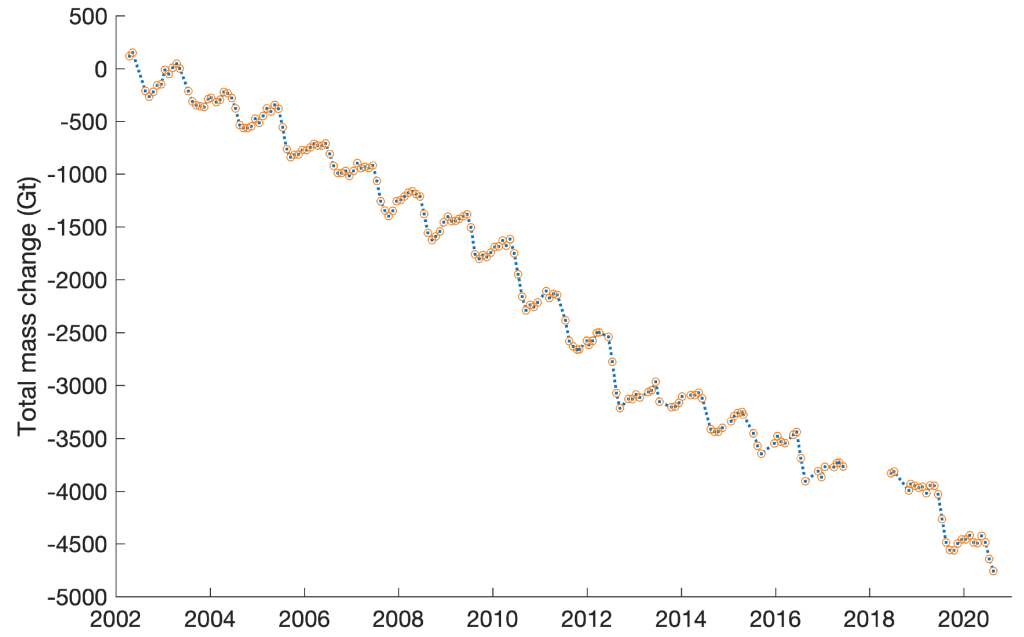
The total mass change of the ice sheet must be measured to evaluate annual contributions to sea level rise. The GRACE (Gravity Recovery and Climate Experiment, 2002-2017) and GRACE-FO (Follow On, 2018-present) satellite missions have revolutionized the ability to monitor mass changes on the Earth’s surface. Over the full span of both missions, the average rate of mass loss for the Greenland ice sheet is 268 ± 14 Gt yr-1 (2-σ model fit uncertainties reported) (Fig. 5). Over the 2018/19 season, a new record annual mass loss of 532 ± 58 Gt was observed (Sasgen et al. 2020), marking a dramatic change from the decreased annual mass losses of about 100 Gt yr-1 over 2017/18. GRACE-FO data extending through August 2020 show that the September 2019-August 2020 annual mass loss is -293 ± 66 Gt, above the multi-mission average but substantially lower than was observed in 2019 (Fig. 5).
Acknowledgments
Financial support for measurements along the K-transect was received from the Dutch Polar Program of NWO. Data from the Programme for Monitoring of the Greenland Ice Sheet (PROMICE) and the Greenland Analogue Project (GAP) were provided by the Geological Survey of Denmark and Greenland (GEUS) at http://www.promice.dk. T. M. was supported by the University of Colorado Boulder Cooperative Institute for Research in Environmental Sciences. M. T. was supported by National Science Foundation ANS #1713072, National Science Foundation PLR-1603331, NASA MAP #80NSSC17K0351, NASA #NNX17AH04G, and the Heising-Simons foundation.
References
Andersen, J. K., and Coauthors, 2019: Update of annual calving front lines for 47 marine terminating outlet glaciers in Greenland (1999-2018). Geol. Surv. Den. Greenl., 43, e2019430202, https://doi.org/10.34194/GEUSB-201943-02-02.
Box, J. E., D. van As, and K. Steffen, 2017: Greenland, Canadian and Icelandic land ice albedo grids (2000-2016). Geol. Surv. Den. Greenl., 38, 53-56.
Fausto, R. S., and D. van As, 2019: Programme for monitoring of the Greenland ice sheet (PROMICE): Automatic weather station data, version: v03, Geological Survey of Denmark and Greenland, https://doi.org/10.22008/promice/data/aws (last access: 14 September 2020).
Loomis, B. D., S. B. Luthcke, and T. J. Sabaka, 2019a: Regularization and error characterization of GRACE mascons. J. Geodesy, 93, 1381–1398, https://doi.org/10.1007/s00190-019-01252-y.
Loomis, B. D., K. E. Rachlin, and S. B. Luthcke, 2019b: Improved Earth oblateness rate reveals increased ice sheet losses and mass-driven sea level rise. Geophys. Res. Lett., 46, 6910-6917, https://doi.org/10.1029/2019GL082929.
Loomis, B. D., K. E. Rachlin, D. N. Wiese, F. W. Landerer, and S. B. Luthcke, 2020: Replacing GRACE/GRACE-FO C30 with satellite laser ranging: Impacts on Antarctic Ice Sheet mass change. Geophys. Res. Lett., 47(3), e2019GL085488, https://doi.org/10.1029/2019gl085488.
Mankoff, K. D., A. Solgaard, W. Colgan, A. P. Ahlstrøm, S. A. Khan, and R. S. Fausto, 2020: Greenland Ice Sheet solid ice discharge from 1986 through March 2020. Earth Syst. Sci. Data, 12, 1367–1383, https://doi.org/10.5194/essd-12-1367-2020.
Morlighem, M., and Coauthors, 2017: BedMachine v3: Complete bed topography and ocean bathymetry mapping of Greenland from multibeam echo sounding combined with mass conservation. Geophys. Res. Lett., 44(21), 11051-11061, https://doi.org/10.1002/2017GL074954.
Mote, T., 2007: Greenland surface melt trends 1973-2007: Evidence of a large increase in 2007. Geophys. Res. Lett., 34, L22507, https://doi.org/10.1029/2007GL031976.
Mouginot, J., and Coauthors, 2019: Forty-six years of Greenland Ice Sheet mass balance from 1972 to 2018. Proc. Natl. Acad. Sci. USA, 116(19), 9239–9244, https://doi.org/10.1073/pnas.1904242116.
Peltier, W. R., D. F. Argus, and R. Drummond, 2018: Comment on “An Assessment of the ICE-6G_C (VM5a) Glacial Isostatic Adjustment Model” by Purcell et al. J. Geophys. Res.-Solid Earth, 123, 2019-2018, https://doi.org/10.1002/2016JB013844.
Sasgen, I., and Coauthors, 2020: Return to rapid ice loss in Greenland and record loss in 2019 detected by the GRACE-FO satellites. Commun. Earth. Environ., 1, 8, https://doi.org/10.1038/s43247-020-0010-1.
Sun, Y., R. Riva, and P. Ditmar, 2016: Optimizing estimates of annual variations and trends in geocenter motion and J2 from a combination of GRACE data and geophysical models. J. Geophys. Res.-Solid Earth, 121, 8352–8370, https://doi.org/10.1002/2016JB013073.
Tedesco, M., X. Fettweis, T. Mote, J. Wahr, P. Alexander, J. Box, and B. Wouters, 2013: Evidence and analysis of 2012 Greenland records from spaceborne observations, a regional climate model and reanalysis data. Cryosphere, 7, 615-630, https://doi.org/10.5194/tc-7-615-2013.
van As, D., R. S. Fausto, J. Cappelen, R. S. van de Wa, R. J. Braithwaite, H. Machguth, and PROMICE project team, 2016: Placing Greenland ice sheet ablation measurements in a multi-decadal context. GEUS Bull., 35, 71-74, https://doi.org/10.34194/geusb.v35.4942.
van den Broeke, M. R., C. J. P. P. Smeets, and R. S. W. van de Wal, 2011: The seasonal cycle and interannual variability of surface energy balance and melt in the ablation zone of the west Greenland ice sheet. Cryosphere, 5, 377-390, https://doi.org/10.5194/tc-5-377-2011.
Wahr, J., M. Molenaar, and F. Bryan, 1998: Time variability of the Earth’s gravity field: Hydrological and oceanic effects and their possible detection using GRACE. J. Geophys. Res.-Solid Earth, 103(B12), 30205-30229, https://doi.org/10.1029/98JB02844.
November 9, 2020