
G. V. Frost1, M. J. Macander1, U. S. Bhatt2, L. T. Berner3, J. W. Bjerke4, H. E. Epstein5, B. C. Forbes6, S. J. Goetz3, M. J. Lara7,8, T. Park9,10, G. K. Phoenix11, S. P. Serbin12, H. Tømmervik4, D. A. Walker13, and D. Yang12,14
1Alaska Biological Research, Inc., Fairbanks, AK, USA
2Geophysical Institute, University of Alaska Fairbanks, Fairbanks, AK, USA
3School of Informatics, Computing and Cyber Systems, Northern Arizona University, Flagstaff, AZ, USA
4Norwegian Institute for Nature Research, FRAM – High North Research Centre for Climate and the Environment, Tromsø, Norway
5Department of Environmental Sciences, University of Virginia, Charlottesville, VA, USA
6Arctic Centre, University of Lapland, Rovaniemi, Finland
7Department of Plant Biology, University of Illinois, Urbana, IL, USA
8Department of Geography, University of Illinois, Urbana, IL, USA
9Ames Research Center, NASA, Mountain View, CA, USA
10Bay Area Environmental Research Institute, Moffett Field, CA, USA
11School of Biosciences, University of Sheffield, Sheffield, UK
12Environmental and Climate Sciences Department, Brookhaven National Laboratory, Upton, NY, USA
13Institute of Arctic Biology, University of Alaska Fairbanks, Fairbanks, AK, USA
14Department of Ecology and Evolution, Stony Brook University, Stony Brook, NY, USA
Highlights
- 2021 continued a recent series of years with exceptionally high midsummer tundra productivity, or “greenness.”
- The five highest circumpolar tundra greenness measurements in the long-term satellite record (1982-2020) have all been recorded in the last 10 years.
- Satellites provide unequivocal evidence of widespread tundra greening, but extreme events and other drivers of local-scale “browning” have also become more frequent, highlighting regional variability as an increasing component of Arctic change.
Introduction
Earth’s northernmost continental landmasses and island archipelagos are home to the Arctic tundra biome, a 5.1 million km2 region characterized by low-growing, treeless vegetation adapted to short, cool summers (CAVM Team 2003). The Arctic tundra biome has long been a “hotspot” of global environmental change, because vegetation and underlying permafrost soils are strongly influenced by warming air temperatures and the rapid decline of sea ice on the nearby Arctic Ocean (Bhatt et al. 2021; see essays Surface Air Temperature and Sea Ice). In the late 1990s, a pronounced increase in the productivity of tundra vegetation became evident in global satellite observations, a phenomenon that has come to be known as “the greening of the Arctic.” Arctic greening is dynamically linked with Earth’s changing climate, permafrost, seasonal snow, and sea-ice cover, and has continued to be a focal point of multi-disciplinary scientific research. Today, a growing constellation of spaceborne satellite sensors and emerging airborne technologies such as unoccupied aerial systems (UAS), or “drones,” provide increasingly detailed observations of Arctic ecosystems.
Satellite observations of tundra greenness
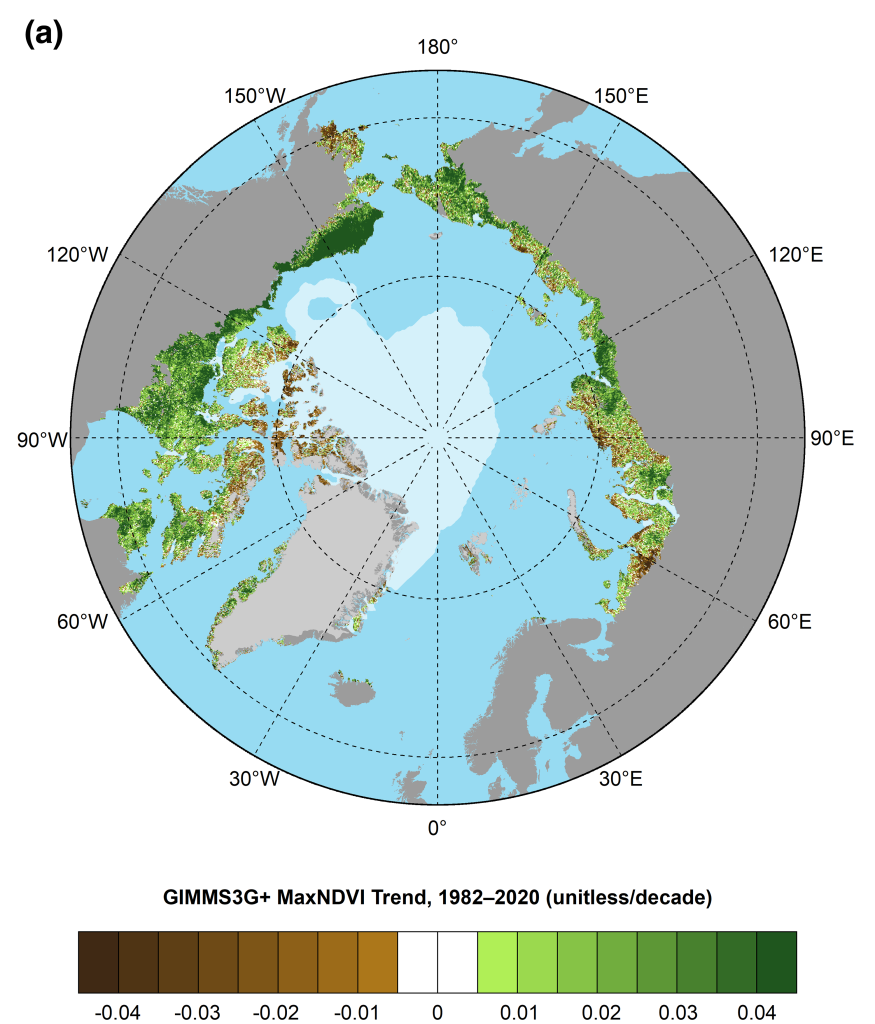
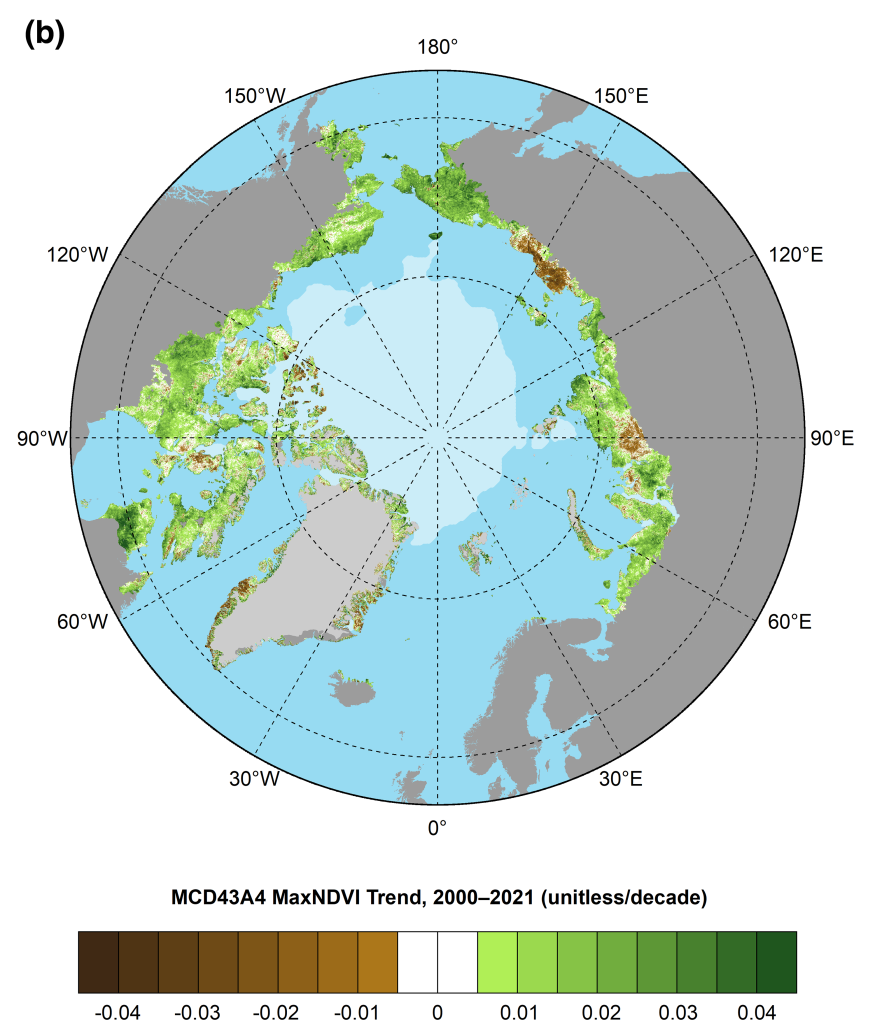
Arctic tundra greenness has been monitored from space since 1982 by the Advanced Very High Resolution Radiometer (AVHRR), and since 2000 by the Moderate Resolution Imaging Spectroradiometer (MODIS). Both satellite sensors monitor vegetation greenness using the Normalized Difference Vegetation Index (NDVI), a spectral metric that exploits the unique way in which green vegetation reflects light in the visible and infrared wavelengths. The AVHRR and MODIS records both indicate that the yearly maximum tundra greenness (MaxNDVI) has increased across most of the circumpolar Arctic during 1982-2020 and 2000-21, respectively (Figs. 1a,b). Several Arctic regions display particularly strong trends in both records. In North America, greening has been strongest in northern Alaska and mainland Canada, while flat or negative (“browning”) trends are evident in parts of the Canadian Arctic Archipelago and southwestern Alaska. In Eurasia, strong greening has occurred in the Russian Far East (Chukotka), but browning is evident in the East Siberian Sea sector and parts of the Taymyr Peninsula. Trends in northwestern Siberia and the European Arctic provide mixed signals, which may be due to the different periods across the two satellite records. Regional contrasts in greenness highlight the complexity of Arctic change, and the rich web of interactions that exist between tundra ecosystems and the local properties of sea ice, permafrost, seasonal snow, soil composition and moisture, disturbance processes, wildlife, and human activities (Buchwal et al. 2020; Myers-Smith et al. 2020; Campbell et al. 2021).
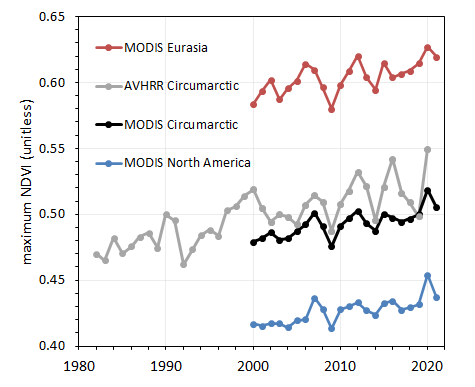
In 2020—the most recent year with observations from both AVHRR and MODIS—both sensors observed record-high MaxNDVI values for Eurasia, North America, and the circumpolar region as a whole, concurrent with record-high Arctic surface temperatures and record-low snow cover that year (see essay Terrestrial Snow Cover). In 2021, the circumpolar MODIS-observed MaxNDVI value declined 2.7% from the previous year, but was still the second highest value in the 22-year record for that sensor. Further, the overall trend in MODIS-observed circumpolar MaxNDVI is strongly positive, and circumpolar values have exceeded the 22-year mean in 11 of the last 12 growing seasons (Fig. 2). The AVHRR record also indicates increasing annual mean circumpolar MaxNDVI for both the full record (1982-2020) and the period of overlap with MODIS (2000-20).
Interpretation of greening trends
What are the drivers that underlie the greening trends observed from space, and what types of change might an observer see on the ground? Recent low-altitude remote sensing and field-based studies provide detail and context for understanding changes in vegetation and landscape features that underlie the greenness trends observed by satellites. Increases in the abundance and height of Arctic shrubs are a key driver of Arctic greening, and have important impacts on biodiversity, surface energy balance, permafrost temperatures, and biogeochemical cycling (Kropp et al. 2021; Mekonnen et al. 2021). However, many Arctic landscapes are a complex mosaic of lakes, ponds, marshes, and vegetated terrain, and this heterogeneity presents challenges in quantifying the drivers and impacts of shrub increase on tundra ecosystems. The emergence of UAS has opened new windows to study the influence of shrub increase both in the “big picture” of Arctic greening, and on the structure and function of ecosystems in specific tundra landscapes. For example, in western Alaska, Yang et al. (2021) observed a reduction in plant species richness in areas with higher abundance of tall shrubs. With these fine-scale UAS datasets, the scale-gap between field- and satellite-observed patterns of vegetation change will begin to close, enabling more detailed monitoring of vegetation composition, structure, and function to track changes across the Arctic.
The timing of phenological events and the duration of the Arctic growing season are useful indicators of Arctic climate change that can be tracked both on the ground and from space. Ground-based observation systems provide more frequent measurements beyond the capabilities of satellites, and effectively link the seasonality and spatial patterns of vegetation greenness with spaceborne observations (Parmentier et al. 2021; Swanson 2021). For example, Hemming et al. (2021) used MODIS, time-lapse digital cameras, and field observations to evaluate changes in Northern Hemisphere phenology. They found that climate warming has led to earlier onset (-2.3 ± 0.7 days decade-1) and a later end (1.3 ± 0.9 days decade-1) of growing seasons during 2000-20. Additionally, in Svalbard, Karlsen et al. (2021) used high-resolution satellite data and a network of ground-based cameras to show that the onset of the 2018 growing season was 10 days earlier than in 2017, highlighting the variability in seasonality that can influence tundra greenness from year to year.
Although the satellite record provides unequivocal evidence of widespread tundra greening, there is substantial regional variability. Greening is not occurring everywhere; many parts of the Arctic exhibit little or no trend (Callaghan et al. 2021), and some regions, such as the East Siberian Sea sector, exhibit widespread browning, due in part to ground subsidence and increased surface water triggered by permafrost thaw (Veremeeva et al. 2021; see essay Glacier and Permafrost Hazards). Die-back or removal of vegetation can also be caused by ecological disturbances, including wildfire (Gaglioti et al. 2021), permafrost thaw (Magnússon et al. 2021), herbivory and pest outbreaks (Veselkin et al. 2021), and the construction of beaver dams (Jones et al. 2020; see Beaver essay). While warming is likely to continue to drive Arctic greening, extreme events and other causes of browning are also increasing in frequency (Christensen et al. 2021), highlighting the emergence of increased variability as a component of Arctic climate change.
Methods and data
The satellite record of Arctic tundra greenness began in 1982 using the Advanced Very High Resolution Radiometer (AVHRR), a sensor that collects daily observations and continues to operate onboard polar-orbiting satellites. As of September 2021, however, processed AVHRR data were only available through the 2020 growing season. Therefore, we also report observations from the Moderate Resolution Imaging Spectroradiometer (MODIS), a more modern sensor with improved calibration and spatial resolution that became operational in 2000. The long-term AVHRR dataset analyzed here for 1982-2020 is the Global Inventory Modeling and Mapping Studies 3g V1.2 dataset (GIMMS-3g+), which is based on corrected and calibrated AVHRR data with a spatial resolution of about 8 km (Pinzon and Tucker 2014). For MODIS, we computed tundra greenness trends for 2000-21 at a much higher spatial resolution of 500 m from daily Nadir Bidirectional Reflectance Distribution Function Adjusted Reflectance data (MCD43A4, version 6; Schaaf and Wang 2015). Data were masked to include only ice-free land within the extent of the Circumpolar Arctic Vegetation Map (CAVM Team 2003); MODIS data were further masked to exclude permanent water based on the 2015 MODIS Terra Land Water Mask (MOD44W, version 6). We summarize the GIMMS-3g+ and MODIS records for Maximum NDVI (MaxNDVI), the peak yearly value that is strongly correlated with the biomass of aboveground vegetation during midsummer (Raynolds et al. 2012). The seasonal timing of MaxNDVI varies from year to year and from place to place, but occurs during the months of July and August for most of the Arctic. MaxNDVI time-series for the two sensors show similar patterns and trends for the period of overlap (2000-20), but the AVHRR record displays higher variability (i.e., “noise”), particularly over the last 5 years of the record. This is likely due in part to AVHRR’s lower spatial resolution and less advanced calibration compared to MODIS.
Acknowledgments
We thank Jorge Pinzon at the Biospheric Sciences Laboratory, NASA Goddard Space Flight Center for providing updates for the GIMMS-3g+ dataset.
References
Bhatt, U. S., and Coauthors, 2021: Climate drivers of Arctic tundra variability and change using an indicators framework. Environ. Res. Lett., 16, 055019, https://doi.org/10.1088/1748-9326/abe676.
Buchwal, A., and Coauthors, 2020: Divergence of Arctic shrub growth associated with sea ice decline. Proc. Natl. Acad. Sci. USA, 117, 33334-33344, https://doi.org/10.1073/pnas.2013311117.
Callaghan, T. V., R. Cazzolla Gatti, and G. Phoenix, 2021: The need to understand the stability of arctic vegetation during rapid climate change: An assessment of imbalance in the literature. Ambio, https://doi.org/10.1007/s13280-021-01607-w.
Campbell, T. K. F., T. C. Lantz, R. H. Fraser, and D. Hogan, 2021: High Arctic vegetation change mediated by hydrological conditions. Ecosystems, 24, 106-121, https://doi.org/10.1007/s10021-020-00506-7.
CAVM Team, 2003: Circumpolar Arctic vegetation map (1:7,500,000 scale). Conservation of Arctic Flora and Fauna (CAFF) Map No. 1. U.S. Fish and Wildlife Service, Anchorage, AK.
Christensen, T. R., and Coauthors, 2021: Multiple ecosystem effects of extreme weather events in the Arctic. Ecosystems, 24, 122-136, https://doi.org/10.1007/s10021-020-00507-6.
Gaglioti, B. V., and Coauthors, 2021: Tussocks enduring or shrubs greening: Alternate responses to changing fire regimes in the Noatak River Valley, Alaska. J. Geophys. Res.-Biogeosci., 126, e2020JG006009, https://doi.org/10.1029/2020JG006009.
Hemming, D. L., J. Garforth, J. O’Keefe, T. Park, A. D. Richardson, T. Rutishauser, T. H. Sparks, and S. J. Thackeray, 2021: Phenology of primary producers [in “State of the Climate in 2020”]. Bull. Amer. Meteor. Soc., 102, S108-S111.
Jones, B. M., K. D. Tape, J. A. Clark, I. Nitze, G. Grosse, and J. Disbrow, 2020: Increase in beaver dams controls surface water and thermokarst dynamics in an Arctic tundra region, Baldwin Peninsula, northwestern Alaska. Environ. Res. Lett., 15, 075005, https://doi.org/10.1088/1748-9326/ab80f1.
Karlsen, S. R., L. Stendardi, H. Tømmervik, L. Nilsen, I. Arntzen, and E. J. Cooper, 2021: Time-series of cloud-free Sentinel-2 NDVI data used in mapping the onset of growth of central Spitsbergen, Svalbard. Remote Sens., 13, 3031, https://doi.org/10.3390/rs13153031.
Kropp, H., and Coauthors, 2021: Shallow soils are warmer under trees and tall shrubs across Arctic and Boreal ecosystems. Environ. Res. Lett., 16, 015001, https://doi.org/10.1088/1748-9326/abc994.
Magnússon, R. Í., J. Limpens, D. Kleijn, K. Huissteden, T. C. Maximov, S. Lobry, and M. M. P. D. Heijmans, 2021: Shrub decline and expansion of wetland vegetation revealed by very high resolution land cover change detection in the Siberian lowland tundra. Sci. Total Environ., 782, 146877, https://doi.org/10.1016/j.scitotenv.2021.146877.
Mekonnen, Z. A., and Coauthors, 2021: Arctic tundra shrubification: a review of mechanisms and impacts on ecosystem carbon balance. Environ. Res. Lett., 16, 053001, https://doi.org/10.1088/1748-9326/abf28b.
Myers-Smith, I. H., and Coauthors, 2020: Complexity revealed in the greening of the Arctic. Nat. Climate Change, 10, 106-117, https://doi.org/10.1038/s41558-019-0688-1.
Parmentier, F. -J. W., L. Nilsen, H. Tømmervik, and E. J. Cooper, 2021: A distributed time-lapse camera network to track vegetation phenology with high temporal detail and at varying scales. Earth Syst. Sci. Data, 13, 3593-3606, https://doi.org/10.5194/essd-13-3593-2021.
Pinzon, J. E., and C. J. Tucker, 2014: A non-stationary 1981-2012 AVHRR NDVI3g time series. Remote Sens., 6, 6929-6960, https://doi.org/10.3390/rs6086929.
Raynolds, M. K., D. A. Walker, H. E. Epstein, J. E. Pinzon, and C. J. Tucker, 2012: A new estimate of tundra-biome phytomass from trans-Arctic field data and AVHRR NDVI. Remote Sens. Lett., 3, 403-411, https://doi.org/10.1080/01431161.2011.609188.
Schaaf, C., and Z. Wang, 2015: MCD43A4 MODIS/Terra+Aqua BRDF/Albedo Nadir BRDF Adjusted Ref Daily L3 Global – 500m V006. NASA EOSDIS Land Processes DAAC [Nadir BRDF-Adjusted Reflectance (NBAR) Daily L3 Global 500 m SIN Grid], accessed 1 September 2021, https://doi.org/10.5067/MODIS/MCD43A4.006.
Swanson, D. K., 2021: Start of the green season and Normalized Difference Vegetation Index in Alaska’s Arctic national parks. Remote Sens., 13, 2554, https://doi.org/10.3390/rs13132554.
Veremeeva, A., I. Nitze, F. Günther, G. Grosse, and E. Rivkina, 2021: Geomorphological and climatic drivers of thermokarst lake area increase trend (1999-2018) in the Kolyma Lowland yedoma region, north-eastern Siberia. Remote Sens., 13, 178, https://doi.org/10.3390/rs13020178.
Veselkin, D. V., L. M. Morozova, and A. M. Gorbunova, 2021: Decrease of NDVI values in the southern tundra of Yamal in 2001-2018 correlates with the size of domesticated reindeer population. Sovrem. Probl. Distantsionnogo Zondirovaniya Zemli Iz Kosmosa, 18, 143-155, https://doi.org/10.21046/2070-7401-2021-18-2-143-155.
Yang, D., and Coauthors, 2021: Landscape-scale characterization of Arctic tundra vegetation composition, structure, and function with a multi-sensor unoccupied aerial system. Environ. Res. Lett., 16, 085005, https://doi.org/10.1088/1748-9326/ac1291.
November 17, 2021