
L. C. Brown1 and C. R. Duguay2
1Department of Geography, Geomatics and Environment, University of Toronto Mississauga, Mississauga, ON, Canada
2Department of Geography and Environmental Management, University of Waterloo, Waterloo, ON, Canada
Highlights
- Striking differences were observed between lake ice durations in Eurasia and North America, with substantially longer than average ice durations in Eurasia and predominantly shorter in North America.
- Freeze-up occurred later than the 2004-20 average for most of North America (except for western Alaska), with notably later freeze in Canada (~10-20 days later), where warmer temperatures and more snow free days were noted in the fall.
- Ice break-up across the Arctic was mainly within ±10 days of the 2004-21 average, except for some lakes in Europe where later break-up was detected.
- Longer ice durations than average in Europe, particularly southern Finland, were due to both earlier freeze-up (~10-30 days) and later break-up (~10-20 days).
Introduction
Lake ice cover is an important component of the cryosphere and changes to the timing of ice freeze-up, break-up, duration, and thickness can have substantial impacts on weather and climate, transportation, and ecology (e.g., Brown and Duguay 2010; Arp et al. 2019). Since lake ice is predominantly influenced by air temperature changes it is a robust indicator of regional climate trends and variability.
Ground-based observations of lake ice have provided valuable information on long-term trends and variability in the timing and duration of ice cover (e.g., Duguay et al. 2006). Satellite data are frequently used to examine lake ice changes over larger regions than are possible with ground-based observations alone (e.g., Du et al. 2017; Dauginis and Brown 2021). Recent satellite-based records (2004-19) show slight trends towards shorter lake ice durations, with notable annual and regional variability across the Arctic (Dauginis and Brown 2021). However, the recent season (2021/22) shows the 6th longest average pan-Arctic lake ice durations since 2004.
We examine the lake ice cover in the Arctic using a satellite data product that can identify areas of water larger than 4 km x 4 km. We examine the 2021/22 lake ice season by ice-on timing (the date when ice cover is detected for the rest of the winter season), ice-off timing (the date when ice is no longer detected at the end of the season) and the ice cover duration (the number of days between the ice-on and ice-off dates). Data are presented relative to the 2004/05 to 2020/21 lake ice season mean.
Ice cover duration
The ice cover duration highlights a marked difference between North America and Eurasia with predominantly shorter durations in North America (71% of all North American pixels) and predominantly longer durations in Eurasia (82% of Eurasian pixels) (Fig. 1). Longer ice durations in Europe and Alaska were due to both the early ice-on and later ice-off, while the shorter durations in the rest of North America were influenced by later ice-on with near-mean ice-off timing.
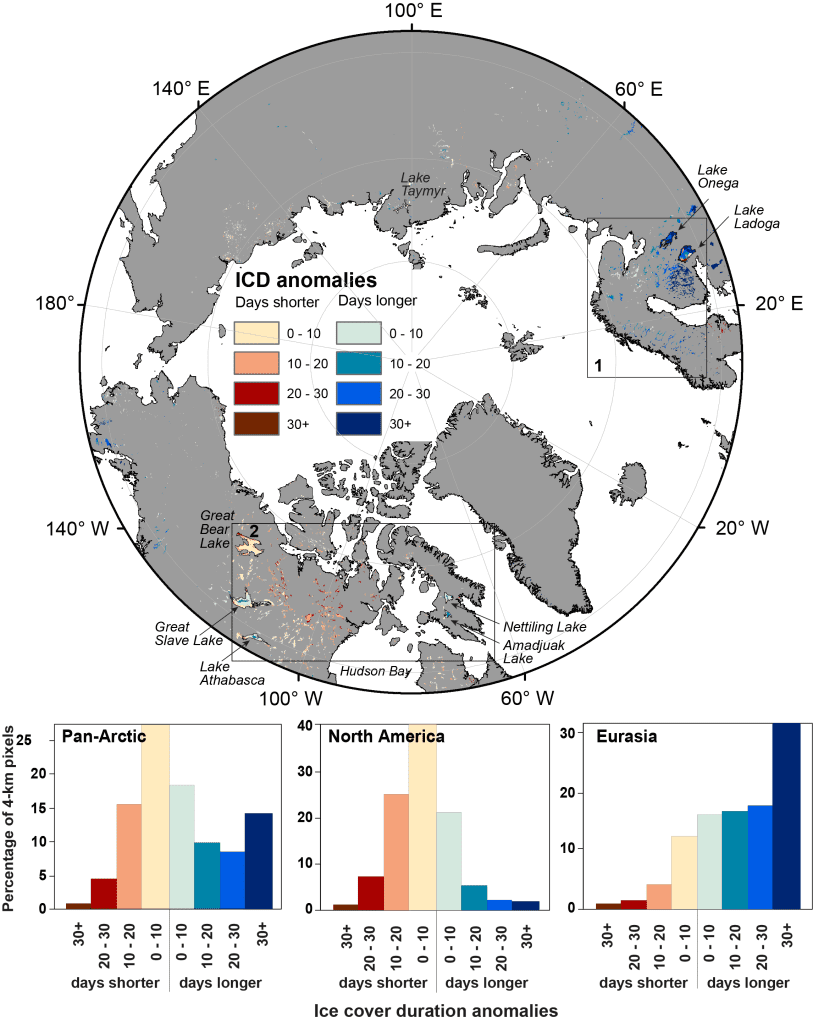
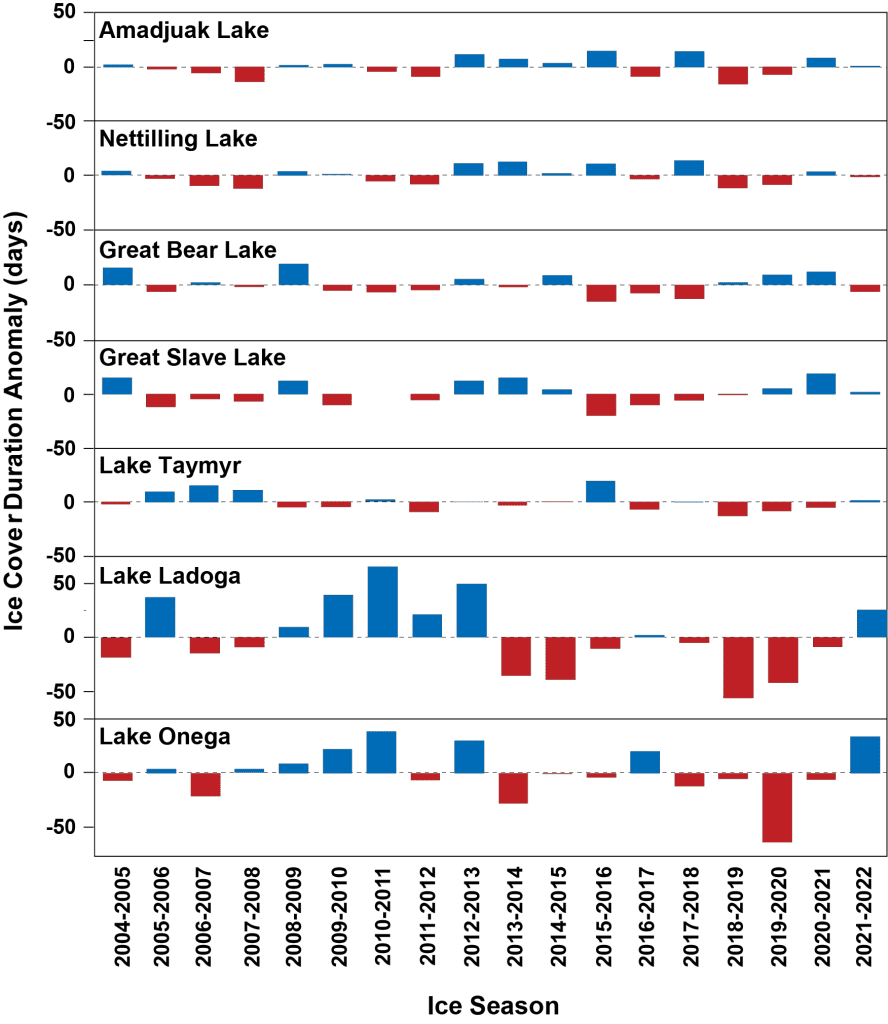
Focusing on the larger lakes (Fig. 2), the North American lakes were all near-mean for their lake-wide ice duration (except for Great Bear Lake at 6 days shorter), and since 2004 have experienced a range of 25-40 days between their shortest and longest mean durations. On the Eurasian side, Lake Taymyr in the north had 1 day longer ice duration, while Lakes Onega and Ladoga were notably longer (Onega: +32 days, 2nd longest duration since 2004/05, and Ladoga: +24 days, 5th longest since 2004/05 and first longer-than-mean duration in several years). The ice durations over the last 18 years are more variable for these lower-latitude lakes where milder winters occur.
Ice-on
Substantial regional variability is shown for ice-on in Eurasia compared to North America (Fig. 3). Forty-seven percent of all lake ice pixels were identified as ice covered 0-20 days later than average; primarily located in North America where most lakes experienced a later freeze. Conversely, 51% of the lake ice pixels experienced an earlier ice-on, with this percentage driven mainly by earlier ice detection in Eurasia and Alaska. Overall, the average ice-on date for the pan-Arctic was 4th earliest since 2004.
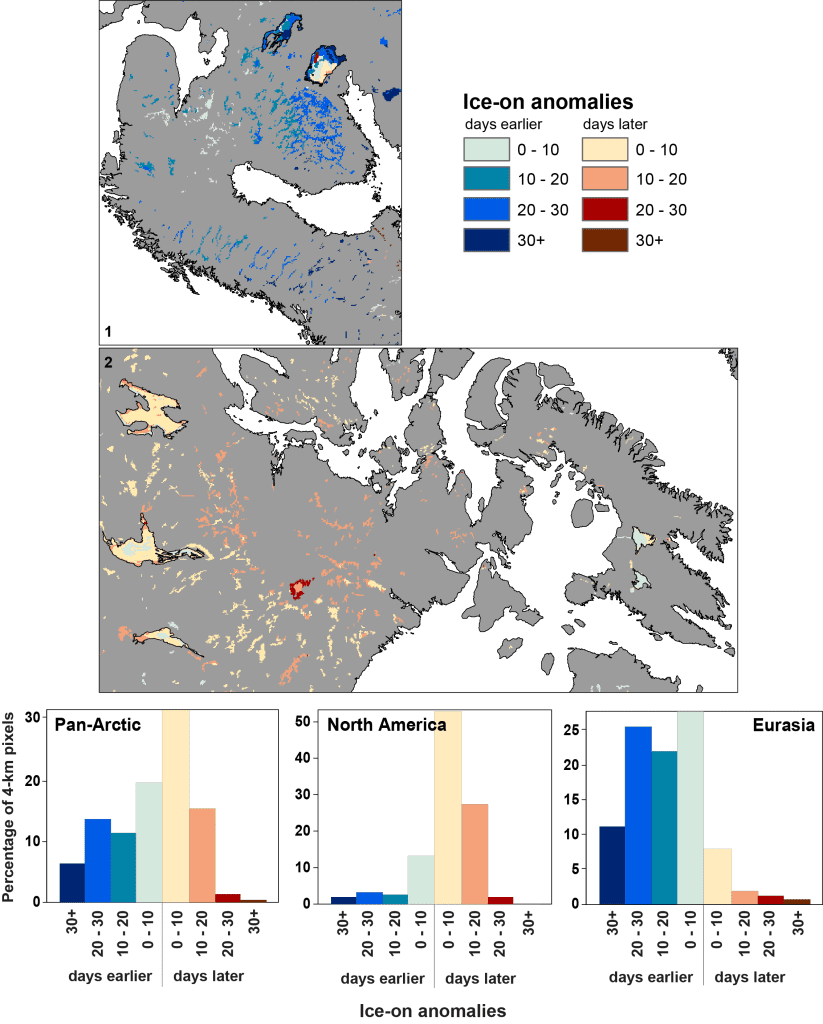
While lakes across Eurasia predominantly experienced earlier ice-on in 2021, some specific regions of later ice-on are evident in southern Sweden. Lake Onega showed earlier ice-on anomalies ranging from a week to a month earlier, while the larger Lake Ladoga experienced earlier ice-on in the southern extent, but later (mainly in the 10-20 days later category) for the rest of the lake.
A particularly early ice cover was detected in southern Finland with a large cluster of lakes forming ice nearly a month earlier than the mean period; early December, rather than the end of December/early January. While the October-December seasonal temperature there was near the climatological mean (see essay Surface Air Temperature), December 2021 experienced 5-6°C cooler than recent (2004-21) December temperatures. A higher percentage of snow-covered days during the snow-onset period were also noted in this region (see essay Terrestrial Snow).
In North America, several Alaskan lakes also showed earlier ice-on dates, ranging up to about a month earlier than average. Earlier freeze in this region corresponds to cooler fall air temperatures, and a longer duration of snow on the ground (see essays Surface Air Temperature and Terrestrial Snow). While Alaskan lakes saw earlier ice-on dates, most North American lakes experienced a later than average ice-on. Lake Athabasca, Great Bear Lake, and Great Slave Lake were near mean (mostly within ~1 week); however, the region to the east of these lakes (to the west of Hudson Bay) experienced later than usual ice-on, reaching up to a month later than the mean (majority in the 10-20 days later category). A warmer than usual fall in this region resulted in lakes in the northern portion freezing in early November rather than late October, and lakes further south freezing in late, rather than early, November. To the northeast, Nettilling and Amadjuak Lakes were near-mean with ~5 days earlier ice-on.
Ice-off
Across the pan-Arctic, ice-off was detected within ±10 days of the mean for 78% of the lake pixels (Fig. 4), with the overall average ice-off date the 5th latest since 2004. In North America, 90% of the lake pixels were near-mean timing, while 59% of Eurasian lake pixels experienced later than usual ice-off timing.
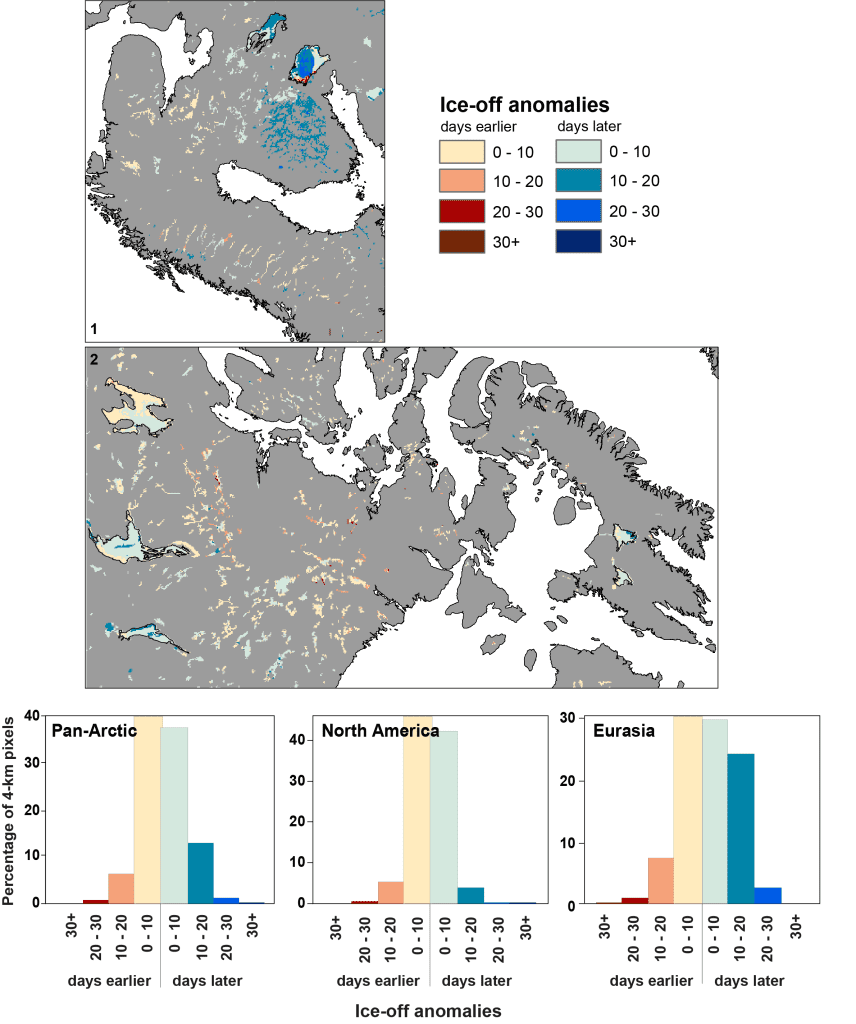
Most of Siberia/Russia experienced later ice-off, which is in agreement with more snow-covered days during the spring in this region (see essay Terrestrial Snow). Southern Finland experienced ice-off ~2 weeks later, with the lakes in this region not becoming fully ice free until mid-May, rather than the typical late April. This later ice-off timing coincided with longer spring snow cover durations (see essay Terrestrial Snow) and ~1-2°C cooler than usual April air temperature (2004-21). The five larger North American lakes observed were mostly within 0-10 days later than the mean ice-off timing, except for Great Bear Lake, where a mix of slightly earlier and slightly later ice-off was detected. The smaller lakes in the region to the northwest of Hudson Bay experienced earlier than usual ice-off (mostly within 10 days earlier) becoming ice free in early July. Shorter spring snow cover durations were seen through this region as well as anomalously warm air temperatures (see essays Surface Air Temperature and Terrestrial Snow).
Methods and data
For this report, lake ice-on, ice-off, and ice duration are derived from the 4-km (2004-present) National Ice Center Interactive Multisensor Snow and Ice Mapping System (IMS) product (U.S. National Ice Center 2008). The IMS product is an operational dataset used to map daily snow and ice cover with input from a variety of multi-sourced datasets (e.g., AVHRR, GOES, SSMI, Ice Charts; for a complete list of data sources, see National Snow and Ice Data Center) to produce maps that distinguish between land, snow-covered land, water, and ice. Analysis for ice cover relies primarily on AVHRR or MODIS imagery; however, when visible imagery is not available, microwave-based retrievals and/or ice climatology are used (Helfrich et al. 2007).
For each pixel, consecutive days of IMS imagery were compared to determine the first and last changes between ice and water to denote the timing of the change from water to ice, and ice to water (e.g., Duguay and Brown 2018; Dauginis and Brown 2021). As lake ice freeze-up and break-up are processes that typically occur over time there could be multiple changes between water and ice during these processes. For this analysis, the final change from water to ice for each pixel was identified as the ice-on date, and the final change from ice to water was identified as the ice-off date, with ice cover duration the time between these dates. Approximately 25,000 pixels are identified as lakes in the region north of 58° N, slightly south of the more usual 60° N used to delineate Arctic regions: ~14,000 in North America and ~11,000 in Eurasia. MODIS Imagery was used to visually confirm some of the IMS-derived dates. Lake-wide ice cover durations were determined using the mean date of all pixels encompassed by the lake boundary, extracted from the Natural Earth free vector and raster map data (Natural Earth 2022).
Monthly air temperature anomalies for the 2021/22 ice season using ERA-5 reanalysis data (Copernicus Climate Change Service 2017) were calculated relative to the same time frame as the IMS data, 2004-present.
References
Arp, C. M., and Coauthors, 2019: Ice roads through lake-rich Arctic watersheds: Integrating climate uncertainty and freshwater habitat responses into adaptive management. Arct. Antarct. Alp. Res., 51(1), 9-23, https://doi.org/10.1080/15230430.2018.1560839.
Brown, L. C., and C. R. Duguay, 2010: The response and role of ice cover in lake-climate interactions. Prog. Phys. Geog., 34, 671-704, https://doi.org/10.1177/0309133310375653.
Copernicus Climate Change Service, 2017: ERA5: Fifth generation of ECMWF atmospheric reanalyses of the global climate, Copernicus Climate Change Service Climate Data Store (CDS), 5 September 2022, https://cds.climate.copernicus.eu/cdsapp#!/home.
Dauginis, A. L., and L. C. Brown, 2021: Recent changes in pan-Arctic sea ice, lake ice, and snow-on/off timing. Cryosphere, 15, 4781-4805, https://doi.org/10.5194/tc-15-4781-2021.
Du, J., J. S. Kimball, C. R. Duguay, Y. Kim, and J. Watts, 2017: Satellite microwave assessment of Northern Hemisphere lake ice phenology from 2002 to 2015. Cryosphere, 11, 47-63, https://doi.org/10.5194/tc-11-47-2017.
Duguay, C. R., and L. Brown, 2018: Lake Ice. Arctic Report Card 2018, E. Osborne, J. Richter-Menge, and M. Jeffries, Eds., https://www.arctic.noaa.gov/Report-Card.
Duguay, C. R., T. D. Prowse, B. R. Bonsal, R. D. Brown, M. P. Lacroix, and P. Ménard, 2006: Recent trends in Canadian lake ice cover. Hydrol. Process., 20, 781-801, https://doi.org/10.1002/hyp.6131.
Helfrich, S. R., D. McNamara, B. H. Ramsay, T. Baldwin, and T. Kasheta, 2007: Enhancements to, and forthcoming developments in the Interactive Multisensor Snow and Ice Mapping System (IMS). Hydrol. Process., 21, 1576-1586, https://doi.org/10.1002/hyp.6720.
Natural Earth , 2022: Free vector and raster map data @ naturalearthdata.com. Accessed: 18 Aug 2022, https://www.naturalearthdata.com/
U.S. National Ice Center, 2008: IMS daily Northern Hemisphere snow and ice analysis at 1 km, 4 km, and 24 km resolutions, version 3. Boulder, Colorado, USA. NSIDC: National Snow and Ice Data Center, accessed: 18 Aug 2022, https://doi.org/10.7265/N52R3PMC.
November 9, 2022