
P. A. Berkman1,2,3, G. J. Fiske4, D. Lorenzini5, O. R. Young6, K. Pletnikoff7,8, J. M. Grebmeier9, L. M. Fernandez10, L. M. Divine11, D. Causey12, K. E. Kapsar13, and L. L. Jørgensen14
1Science Diplomacy Center™, Falmouth, MA, USA
2Program on Negotiation at Harvard Law School, Cambridge, MA, USA
3United Nations Institute for Training and Research (UNITAR), Geneva, Switzerland
4Woodwell Climate Research Center, Falmouth, MA, USA
5AAC SpaceQuest, Fairfax, VA, USA
6Bren School of Environmental Science & Management, University of California Santa Barbara, Santa Barbara, CA, USA
7Aleutian Pribilof Islands Association, Anchorage, AK, USA
8Aleut International Association, Anchorage, AK, USA
9Chesapeake Biological Laboratory, University of Maryland Center for Environmental Science, University of Maryland, Solomons, MD, USA
10Department of Economics, Center for Environmental Studies, Virginia Commonwealth University, Richmond, VA, USA
11Aleut Community of St. Paul Island Tribal Government, St. Paul Island, AK, USA
12Arctic Domain Awareness Center, University of Alaska, Anchorage, AK, USA
13Center for Systems Integration and Sustainability, Department of Fisheries and Wildlife, Michigan State University, East Lansing, MI, USA
14Institute of Marine Research, Tromsø, Norway
Highlights
- Satellite-based records from 1 September 2009 through 31 December 2018 reveal increasing maritime ship traffic, with pronounced seasonality, within all Law of the Sea zones north of the Arctic Circle.
- Arctic maritime ship traffic is increasing as sea ice is diminishing, representing the ‘ship-ice hypothesis’ to test over diverse time and space scales in view of socioeconomic impacts and the dynamics of natural systems.
- Maritime ship traffic into the Central Arctic Ocean High Seas predominates from the Pacific sector through the Bering Strait and Beaufort Sea, as revealed by ship types, sizes, and flag states from 2009-18 with complementary satellite-observed increases in the Bering Sea from 2015 to 2020.
Introduction
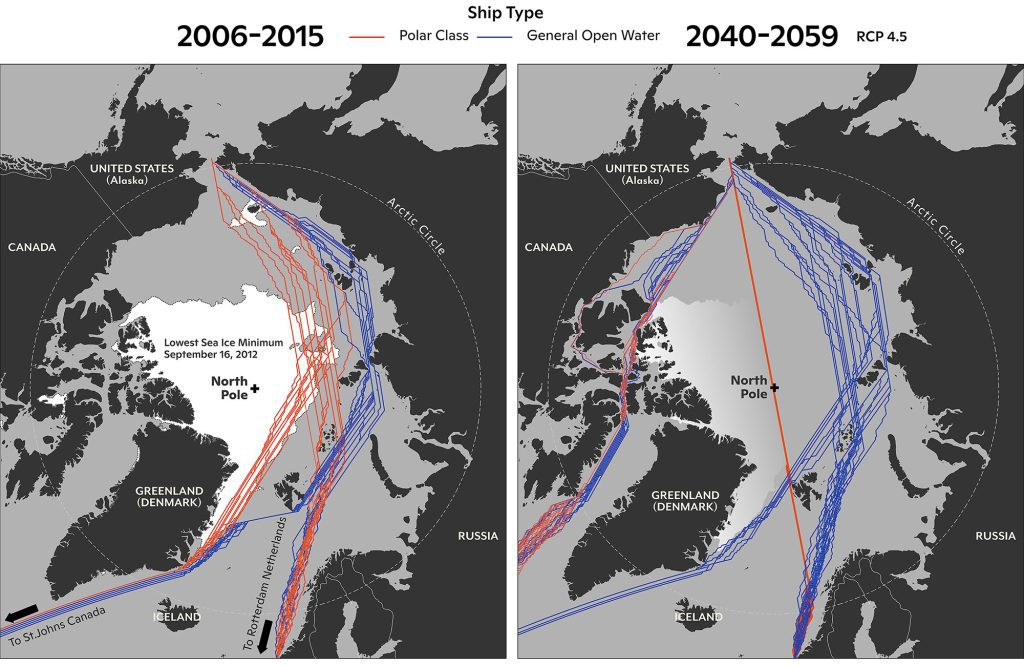
A prominent socioeconomic development in recent years has been an increase in maritime ship traffic (characterized in view of ship movements and attributes of type, size, and flag state) in the Arctic Ocean as the sea ice diminishes with climate warming (see essay Sea Ice). Increasing maritime ship traffic has diverse implications for Arctic and non-Arctic communities in view of emergent and projected shipping routes (Fig. 1). Shipping activities also impact biogeophysical systems, generating environmental and societal risks—especially for Indigenous Peoples, with system impacts in the:
- Atmosphere: Greenhouse gas impacts, including heavy fuel-oil burning that produces black carbon with ice-surface darkness impacts (IMO 2021);
- Ocean: Pollution impacts (Sheffield et al. 2021) on marine ecosystems (see essay Primary Productivity); overharvesting marine living resources; marine species disturbances, including ship strikes on marine mammals and birds; underwater noise (Stafford 2021); and invasive species introductions that change trophic interactions;
- Communities: Port development, socioeconomic impacts, and access changes.
Indigenous communities are the most vulnerable (Sheffield et al. 2021), respecting they have resided continuously on islands and along the coastlines of Arctic landmasses in a resilient manner in the face of ecosystem changes across millennia. The applications and implications of maritime ship traffic also are cross-cutting with the five binding Arctic agreements that have entered into force during the past decade with Arctic states as well as non-Arctic states (Berkman et al. 2022a).
Maritime ship traffic data across jurisdictions in the Arctic Ocean
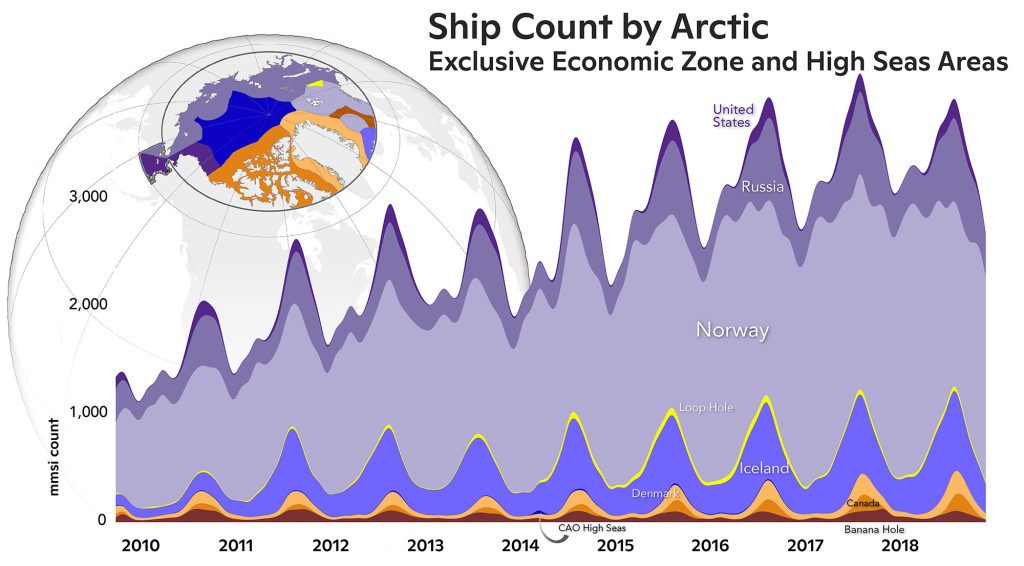
Satellite Automatic Identification System (S-AIS) observations north of the Arctic Circle began on 1 September 2009, enabling synoptic coverage of maritime ship traffic in the Arctic Ocean (see Methods and data). The comprehensive pan-Arctic illustration herein (Fig. 2) is based on the framework of the Law of the Sea, to which the eight Arctic states and six Indigenous Peoples’ organizations “remain committed” (Arctic Council 2013). The Law of the Sea zones are unambiguous in the superjacent waters above the sea floor and objectively defined with the Exclusive Economic Zones (EEZ) beyond and adjacent to the Territorial Sea, extending a maximum of 200 nautical miles from coastal boundaries into the High Seas of the Arctic Ocean (Berkman and Young 2009). This S-AIS baseline from 2009-18 (Berkman et al. 2022b)—which will be brought current with future funding—reveals pronounced seasonality (Fig. 2). The increasing number of ships over time in all national and international maritime jurisdictions north of the Arctic Circle (Tables 1 and 2) raises diverse questions about relative ship-traffic changes and characteristics within as well as between regions seasonally and interannually in view of socioeconomic impacts and the dynamics of natural systems.
| Arctic Ocean Area | Total of Monthly Unique Ship Days1 |
Rate of Change2,3 (2009-18) | ||
|---|---|---|---|---|
| Canada | 2,541 | Annual: +1.2% | Summer: +2.1% | Winter: -0.1% |
| Denmark / Greenland | 7,563 | Annual: +1.7% | Summer: +2.8% | Winter: +0.7% |
| Iceland | 40,644 | Annual: +10.9% | Summer: +15.1% | Winter: +5.3% |
| Norway | 176,048 | Annual: +41.9% | Summer: +47.6% | Winter: +47.9% |
| Russian Federation | 43,950 | Annual: +8.8% | Summer: +12.5% | Winter: +5.0% |
| United States | 6,836 | Annual: +1.0% | Summer: +1.9% | Winter: +0.1% |
1Total number of unique ships derived with S-AIS data in each area north of the Arctic Circle (Fig. 2), summed from 111 monthly totals of ships based on daily observations (Berkman et al. 2022b).
2Ship numbers versus time from 2009-18 (statistically significant trends highlighted in bold).
3Annual and seasonal trends for summer (June-July-August-September) and winter (December-January-February-March) with shoulder periods unanalyzed.
| Arctic Ocean Area | Total of Monthly Unique Ship Days1 |
Rate of Change2,3 (2009-18) | ||
|---|---|---|---|---|
| Banana Hole | 6,426 | Annual: +0.1% | Summer: -0.3% | Winter: +0.5% |
| Central Arctic Ocean (CAO) | 494 | Annual: +0.2% | Summer: +0.3% | Winter: +0.3% |
| Loop Hole | 3,275 | Annual: +1.1% | Summer: +1.4% | Winter: +0.7% |
1Total number of unique ships derived with S-AIS data in each area north of the Arctic Circle (Fig. 2), summed from 111 monthly totals of ships based on daily observations (Berkman et al. 2022b).
2Ship numbers versus time from 2009-18 (statistically significant trends highlighted in bold).
3Annual and seasonal trends for summer (June-July-August-September) and winter (December-January-February-March) with shoulder periods unanalyzed.
The centroid of maritime ship traffic also has shifted hundreds of kilometers to the north and east in the Atlantic sectors (NASA 2018), where maritime ship traffic predominates in the Arctic Ocean (Fig. 2). Complementary analyses of Arctic maritime ship traffic after 2013 are available from the Arctic Ship Traffic Database with redacted S-AIS metadata (Arctic Council 2022) and from other public and private sources (Theocharis et al. 2018).
‘Ship-ice hypothesis’ testing across the Arctic Ocean
Increasing ship traffic with diminishing sea ice has been framed as the ‘ship-ice hypothesis,’ (Berkman et al. 2020a) which has been tested comprehensively in a pan-Arctic context with daily satellite observations of ship traffic and sea ice within 4 km2 grids to reveal ‘ship-ice interactions’ from 2009-16. Testing and elaborating this hypothesis leads to useful insights, such as identifying the threshold increase in ship-ice interactions in the Arctic Ocean after 2013 and toward higher latitudes, following the sea-ice minimum observed by satellites in 2012.
The Central Arctic Ocean (CAO) High Seas (Fig. 2, Table 2) offer a unique regional test of the ‘ship-ice hypothesis’, with diminished sea-ice and open-water seasonally on the Pacific sector adjacent to the 180° EW meridian, in contrast to open water year-round in the Atlantic sectors where the ship traffic predominates (Fig. 2, Table 1). The S-AIS metadata with ship flag state, type, and size attributes (Fig. 3) indicate maritime ship traffic into the CAO High Seas is chiefly originating from the Pacific sector of the Arctic Ocean adjacent to the Bering Strait.
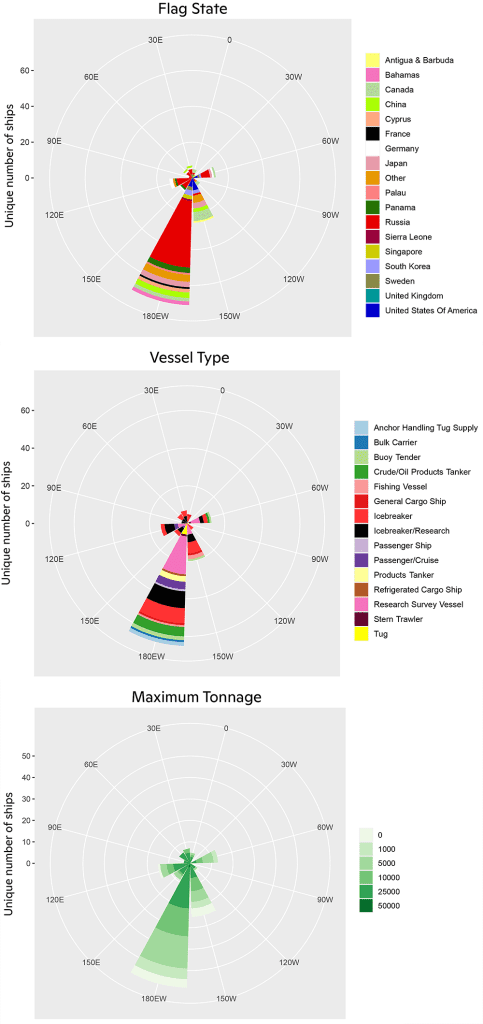
Discovery of the primary movement of maritime ship traffic into the CAO High Seas from the Pacific sector (Fig. 3) reveals risks to address among diverse stakeholders, rightsholders, and actors inclusively since the Bering Strait is the narrowest choke point into and out of the Arctic Ocean. This conclusion is reinforced by S-AIS observations of increasing maritime ship traffic in the Bering Sea from 2015-20 (Kapsar et al. 2022), especially considering adjacent Indigenous communities that have inhabited this region for millennia.
Conclusions
From national security interests to continuous considerations among Arctic communities, S-AIS data provide a synoptic pan-Arctic platform (Table 3) to assess patterns, trends, and processes of socioeconomic change with user-defined granularity across the Arctic Ocean. Understanding increasing maritime ship traffic (Figs. 2 and 3, Tables 1 and 2) in relation to the welfare of surrounding coastal communities, dynamics of natural systems with their biogeophysical features, and socioeconomic development of the Arctic as a whole will inform decisions about investments and response capacities across a ‘continuum of urgencies’ (Berkman et al. 2017) to build resilience in view of Arctic Ocean change.
Methods and data
S-AIS data on a pan-Arctic scale are a technological innovation with distinct advantages, extending the Earth surface observations that had been synthesized from the six Arctic coastal states (Table 1) into the Arctic Marine Shipping Assessment (Arctic Council 2009) and subsequently (Table 3). The baseline S-AIS data herein were collected by AAC SpaceQuest Ltd as part of a public-private partnership supported by the National Science Foundation with Belmont Forum collaborations internationally and deposited in the Arctic Data Center (Berkman et al. 2020b). The key attributes in the S-AIS data are location (latitude and longitude) and timestamp for each unique ship along with metadata about ship characteristics for vessels that are IMO registered.
| Attribute | AMSA (Arctic Council 2009) | Next-Generation AMSA2 |
| Sampling Period | 2004 | 2009 forward |
| Data Sources | Arctic States Individually | Diverse Government and Commercial Satellite Automatic Identification System (S-AIS) Receivers |
| Observation Coverage | Point, Regional | Point, Regional, and Pan-Arctic |
| Observation Scope | Ground-Based | Ground-Based and Satellite |
| Observation Frequency | Inconsistent over Space and Time | Synoptic and Continuous (seconds-decades) |
| Ship-Type Designations | Variable National Designations | Standardized International Designations |
| Individual Ship Attributes | Inconsistent and Incomplete | Consistent and Comprehensive |
| Analytical Capacity | Limited Granularity and Questions | Open-Ended Granularity and Questions |
| Science-Diplomacy Contributions | Scenarios and Negotiated Recommendations | Holistic Evidence and Options (without advocacy) |
| Informed Decisionmaking | Governance Mechanisms | Operations, Built Infrastructure, and Governance Mechanisms |
1Modified from Berkman et al. (2020a).
2Involves ship transponder data received by polar-orbiting satellites.
Geospatial data were integrated over time with the ‘space-time cube’ (in the cloud and analyzed with SQL queries of tables through the Google Compute Engine with BigQuery (Berkman et al. 2020a, 2022b). This analytical approach enabled integration with other spatial datasets with time stamps, as demonstrated with sea-ice data on a pan-Arctic scale within 4 km2 grids to reveal ship-ice interactions. Relational databases in the cloud have a wealth of advantages, including cost-effectiveness, scalability, analytical speed, and n-dimensional dataset integration to ‘future-proof’ next-generation AMSA with user-defined applications.
Acknowledgments
This article is a product of the Science Diplomacy Center™, involving support with the Arctic Options/Pan-Arctic Options projects funded by the United States National Science Foundation (Award Nos. NSF-OPP 1263819, NSF-ICER 1660449 and NSF-OPP 1917434) and through the Belmont Forum with Canada, China, France, Norway, and Russia from 2013-22.
References
Arctic Council, 2009: Arctic Marine Shipping Assessment 2009 Report, 187 pp, https://pame.is/index.php/projects/arctic-marine-shipping/amsa.
Arctic Council, 2013: Vision for the Arctic, 6 pp, https://oaarchive.arctic-council.org/handle/11374/287.
Arctic Council, 2022: Arctic Ship Traffic Data. Accessed 27 September 2022, https://pame.is/index.php/projects/arctic-marine-shipping/astd#astd-geographical-scope.
Berkman, P. A., and O. R. Young, 2009: Governance and environmental change in the Arctic Ocean. Science, 324, 339-340, https://doi.org/10.1126/science.1173200.
Berkman, P. A., L. Kullerud, A. Pope, A. N. Vylegzhanin, and O. R. Young, 2017: The Arctic Science Agreement propels science diplomacy. Science, 358, 596-598, https://doi.org/10.1126/science.aaq0890.
Berkman, P. A., G. Fiske, J.-A. Royset, L. W. Brigham, and D. Lorenzini, 2020a: Next-generation Arctic marine shipping assessments. Governing Arctic Seas: Regional Lessons from the Bering Strait and Barents Sea, Vol. 1, O. R. Young, P. A. Berkman, and A. N. Vylegzhanin, Eds., Springer Nature, 241-268.
Berkman, P. A., G. Fiske, and D. Lorenzini, 2020b: Baseline of Next-Generation Arctic Marine Shipping Assessments – Oldest Continuous Pan-Arctic Satellite Automatic Identification System (AIS) Data Record of Maritime Ship Traffic, 2009-2016, https://doi.org/10.18739/A2TD9N89Z.
Berkman, P. A., J. M. Grebmeier, G. Fiske, and L. L. Jørgenson, 2022a: Satellite observations of maritime ship traffic to enhance implementation of binding agreements in the Arctic Ocean, Arctic Observing Summit 2022, Trømso, Norway, 1-5, https://arcticobservingsummit.org/wp-content/uploads/2022/02/2022_013_Berkman_WG5.pdf.
Berkman, P. A., G. Fiske, J. M. Grebmeier, and A. N. Vylegzhanin, 2022b: Maritime ship traffic in the Central Arctic Ocean High Seas as a case study with informed decisionmaking. Building Common Interests in the Arctic Ocean with Global Inclusion, Vol. 2, P. A. Berkman, A. N. Vylegzhanin, O. R. Young, D. A. Balton, and O. R. Øvretveit, Eds., Springer Nature, 321-346.
IMO, 2021. Further shipping GHG emission reduction measures adopted. International Maritime Organization, London. 17 June 2021, https://www.imo.org/en/MediaCentre/PressBriefings/pages/MEPC76.aspx.
Kapsar, K., B. Sullender, J. Liu, and A. Poe, 2022: North Pacific and Arctic marine traffic dataset (2015-2022). Data in Brief, 44, 108531, https://doi.org/10.1016/j.dib.2022.108531.
NASA, 2018: Shipping Responds to Arctic Ice Decline. Accessed 25 September 2022, https://earthobservatory.nasa.gov/images/91981/shipping-responds-to-arctic-ice-decline.
Sheffield, G., A. Ahmasuk, F. Ivanoff, A. Noongwook, and J. Koonooka, 2021: 2020 Foreign Marine Debris Event—Bering Strait. NOAA Technical Report OAR ARC; 21-12, 8 pp, https://doi.org/10.25923/jwag-eg41.
Smith, L. C., and S. R. Stephenson, 2013: New Trans-Arctic shipping routes navigable by midcentury. P. Natl. Acad. Sci., 10, 6-10, https://doi.org/10.1073/pnas.1214212110.
Stafford, K. M., 2021: The Changing Arctic Marine Soundscape. NOAA Technical Report OAR ARC; 21-14, https://doi.org/10.25923/jagc-4a84.
Theocharis, D., S. Pettit, V. S. Rodrigues, and J. Haider, 2018: Arctic shipping: A systematic literature review of comparative studies. J. Transp. Geogr., 69, 112-128, https://doi.org/10.1016/j.jtrangeo.2018.04.010.
United Nations, 1982: Convention on the Law of the Sea. (Signed: Montego Bay, 10 December 1982; Entry into Force: 16 November 1994), https://www.refworld.org/docid/3dd8fd1b4.html.
January 11, 2023