
L. Mudryk1, A. Elias Chereque2, C. Derksen1, K. Luojus3, and B. Decharme4
1Climate Research Division, Environment and Climate Change Canada, Toronto, ON, Canada
2Department of Physics, University of Toronto, Toronto, ON, Canada
3Arctic Research Centre, Finnish Meteorological Institute, Helsinki, Finland
4Centre National de Recherches Météorologiques, Météo-France, Toulouse, France
Highlights
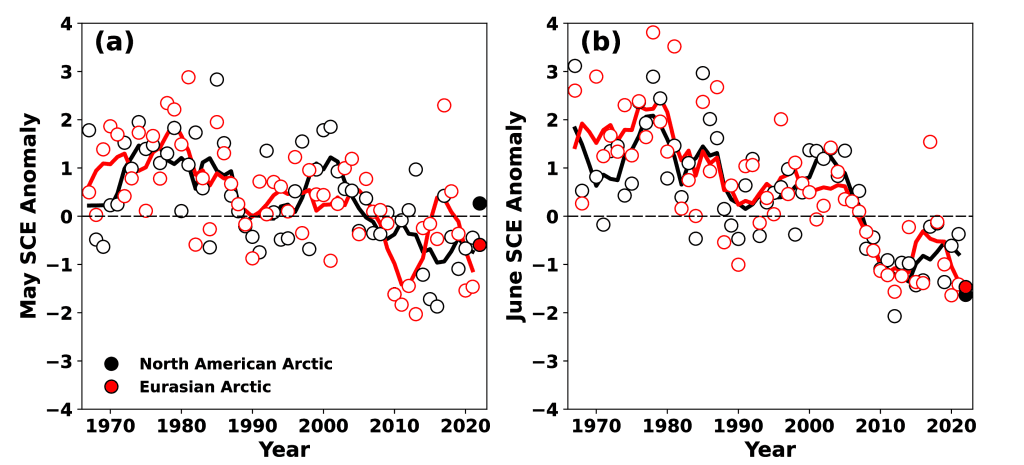
- June Arctic snow cover extent (SCE) anomalies were strongly negative over both North America (2nd lowest in the 56-year record) and Eurasia (3rd lowest in the record).
- The 2021/22 Arctic snow season saw a combination of above-average snow accumulation but early snow melt consistent with the expected changes to snow cover in a warmer Arctic.
Introduction
Many components of the Arctic land surface are directly influenced by snow cover from fall through spring, including the surface energy budget, ground thermal regime, permafrost, and terrestrial and freshwater ecosystems (Brown et al. 2017; Meredith et al. 2019). Even following the snow cover season, the influence of spring snow melt timing persists through impacts on river discharge timing and magnitude, surface water, soil moisture, vegetation phenology, and fire risk (Meredith et al. 2019).
Multiple datasets derived from satellite observations and snowpack models driven by atmospheric reanalyses are used to assess Arctic seasonal snow cover. Collectively, this approach provides a reliable picture of Arctic snow cover variability over the last five decades. We characterize snow conditions across the Arctic land surface using three quantities: how much total land area is covered by snow (snow cover extent – SCE), how long throughout the year snow covers the land surface (snow cover duration – SCD), and how much water is stored in solid form by the snowpack (snow water equivalent – SWE; the product of snow depth and density). We examine each of these quantities in turn for the Arctic snow season spanning fall 2021 through spring 2022.
Snow cover extent and duration
SCE anomalies (relative to the 1991-2020 climatology) in spring 2022 are shown separately for the North American and Eurasian terrestrial sectors of the Arctic in Fig. 1. May anomalies were near the average of the last 30 years in the North American sector (ranked 29th lowest in the 56-year record available since 1967) but below average over the Eurasian sector (ranked 9th lowest). Rapid snow loss in June resulted in very low SCE across both sectors (2nd and 3rd lowest, respectively).
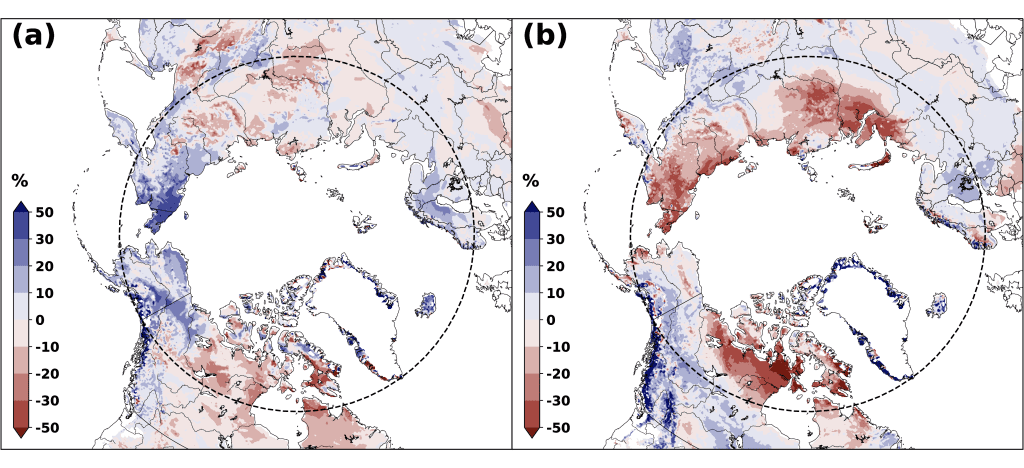
Snow cover duration (SCD) anomalies (relative to a 1998-1999 to 2017-2018 climatology) across the Arctic region for the 2021/22 snow season are shown in Fig. 2 for both snow onset and snow melt periods of the year (see Methods and data). Onset anomalies indicate snow cover during autumn 2021 began earlier than normal over Alaska, Eastern Siberia, and Scandinavia and began later than normal over central Arctic Canada and parts of central Siberia, a pattern consistent with autumn temperature anomalies (see essay Surface Air Temperature) and above-normal precipitation over Alaska and Scandinavia (see essay Precipitation). Melt anomalies during spring 2022 show anomalously low SCD (indicating early melt) across much of the Arctic with three strong maximums: east of the Ural Mountains, across eastern Siberia, and over the Canadian Arctic Archipelago consistent with spring and summer 2022 temperature anomalies (see essay Surface Air Temperature). Similar to spring 2021, the duration of the spring 2022 snow-free period across broad expanses of Eurasia was 30-50% longer than normal.
Snow mass and snow water equivalent
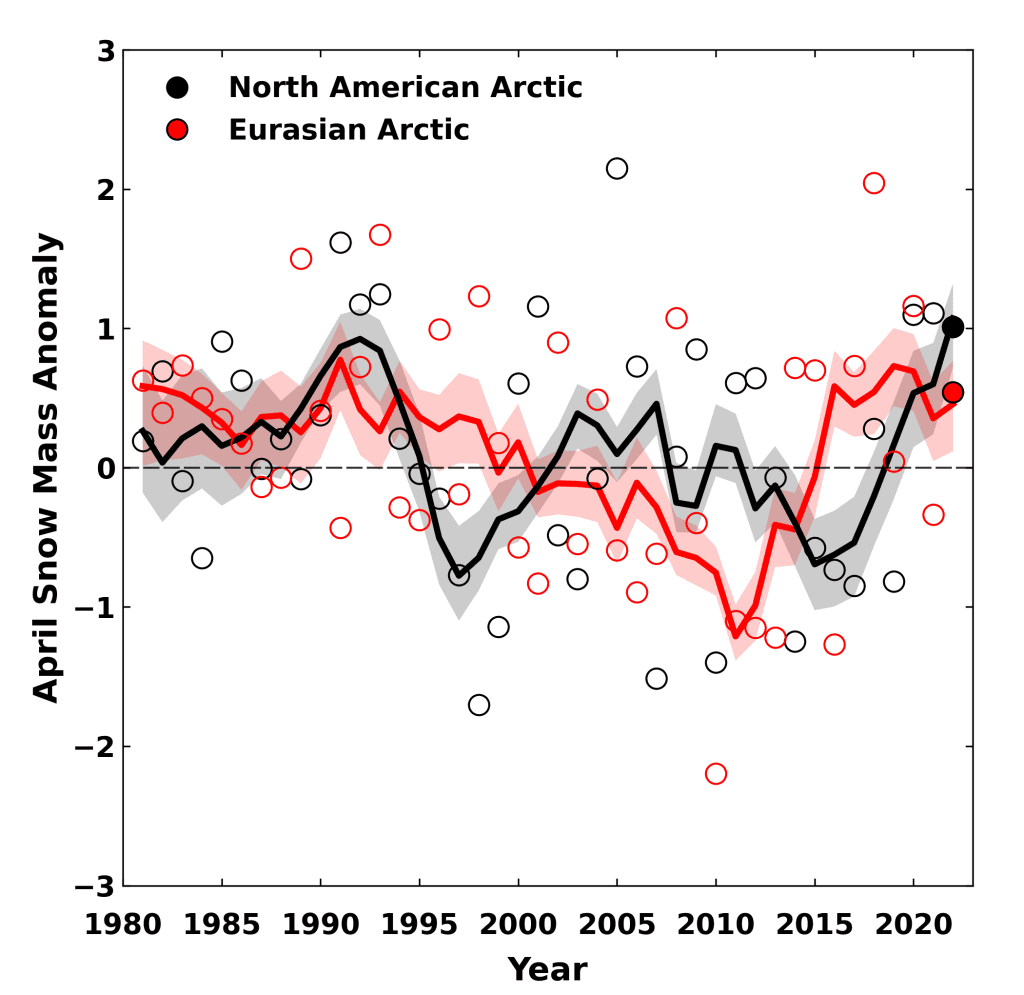
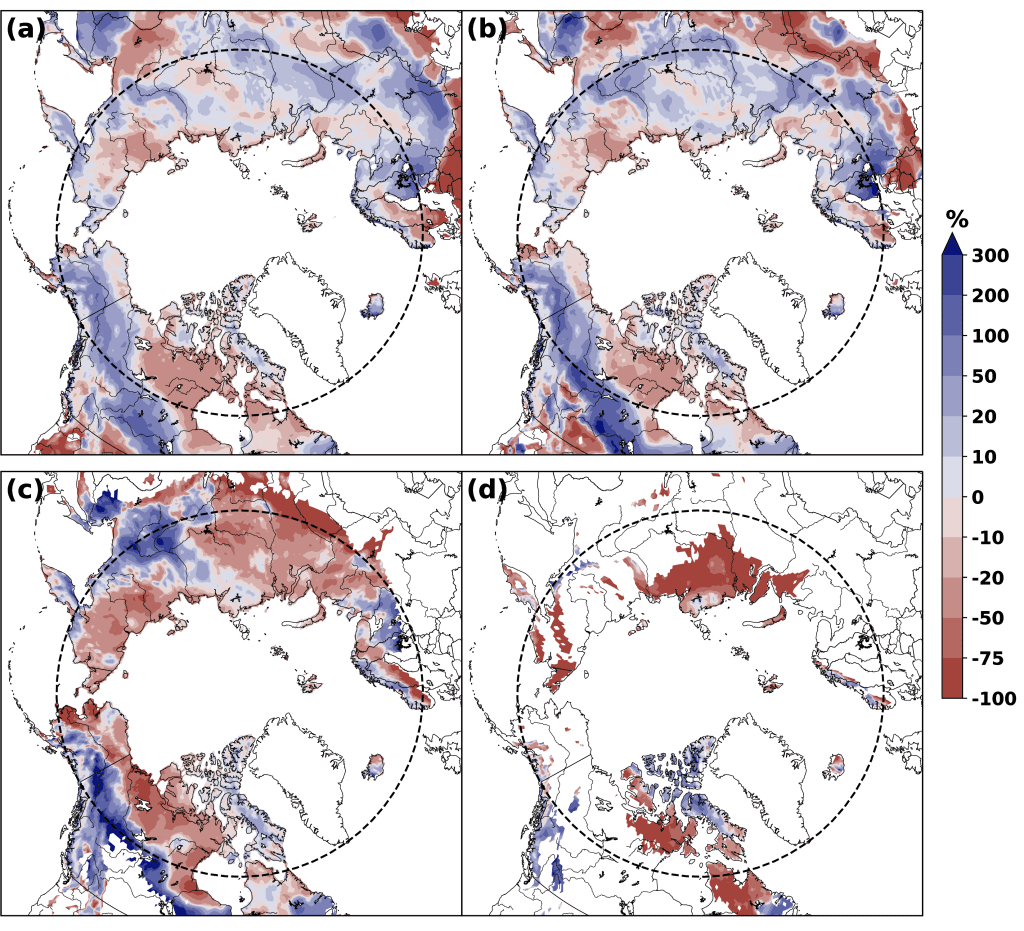
For Arctic regions as a whole, snow mass tends to peak annually during April, when snowfall has accumulated since the preceding autumn but before increasing temperatures during May and June lead to snow melt. Snow mass anomalies for April 2021 (Fig. 3; calculated by aggregating SWE across the Arctic land surface to measure the total mass of water stored by snow across the region) indicate snow accumulation was moderately above the 1991-2020 average across both the Eurasian and North American Arctic. Figure 4 shows the unaggregated SWE field to illustrate how this accumulation varied regionally from just before peak (March) through to the end of the melt period (June). Before May, both continents had mixed distributions of SWE: the northern regions of Arctic Eurasia had lower SWE than normal with higher than normal SWE located further south; in North America, the central Canadian Arctic and northern Alaska had lower than normal SWE while higher than normal accumulations were present south of the Brooks Range and across the Yukon Territory. Melt during May caused widespread reductions in SWE across the Eurasian Arctic and further reduced the snowpack where it was already lower than average in the North American Arctic, consistent with the pattern of SCD anomalies shown in Fig. 2. Similar to the previous year, the 2021/22 Arctic snow season saw a combination of increased snow accumulation (expressed as higher than average April snow mass in Fig. 3) but early snow melt (expressed by shorter than average snow melt periods in Fig. 2b) consistent with the expected changes to Arctic snow cover in a warmer Arctic (Meredith et al. 2019).
Summary and long-term trends
In summary, snow accumulation during the 2021/22 winter was moderately above average across the Arctic. Despite that, spring snow extent was below normal, consistent with the last 15 years. Since 2008, North American June SCE has been below the long-term average every year, while Eurasian June SCE has been below the long-term average for all but 1 year. Long-term trends for total Arctic SCE, derived from the data presented in Fig. 1, are negative: -3.8 ±1.9% per decade, and -18.9 ± 6.6% per decade for May and June, respectively (1981-2022 trends relative to a baseline of 1991-2020). These trends are more strongly negative compared to a range of other sources, as discussed in Mudryk et al. (2017, 2020). The April trend in Arctic snow mass over the 1981-2022 period is more moderate, reflecting large interannual variability. Calculated from the data presented in Fig. 3, the snow mass trend is -1.4 ± 1.9% per decade.
Methods and data
Snow cover extent (SCE) anomalies are derived from the NOAA snow chart climate data record, which extends from 1967 to present (Estilow et al. 2015; Robinson et al. 2012). Monthly anomalies of total areal snow cover over land for a given Arctic sector (North America or Eurasia, > 60° N) are computed and standardized relative to the 1991-2020 period (each observation differenced from the mean and divided by the standard deviation and thus unitless).
Snow cover duration (SCD) fields are derived from the NOAA daily Interactive Multisensor Snow and Ice Mapping System (IMS) snow cover product (U.S. National Ice Center 2008). The IMS snow cover product is used for this analysis since the NOAA snow chart climate data record has spurious trends during autumn (Brown and Derksen 2013; Mudryk et al. 2017) that could alter SCD fields during the onset period. Anomalies in the total number of days with snow cover were computed separately for each half of the snow season: August 2021 to January 2022, referred to as “onset period,” and February 2022 to July 2022, referred to as “melt period.” IMS availability starts in 1998, so a 1999-2018 climatological period is used (including information from Aug-Dec 1998 for snow onset). Anomalies for each season are presented as percent differences from the climatological number of snow-free days. In the Arctic, this varies from approximately three months near 60° N, to approximately two months at 70° N, and decreases to less than a month over the Canadian Arctic Archipelago. Because the Arctic is generally always snow covered between November and April, Arctic region snow onset anomalies are indicative of conditions during September and October, while Arctic region snow melt anomalies are indicative of conditions during May and June.
Four snow water equivalent (SWE) analyses were used to generate multi-dataset SWE fields from March-June for the 1981-2022 period: (1) the European Space Agency Snow CCI SWE version 2 product derived through a combination of satellite passive microwave brightness temperatures and climate station snow depth observations (Luojus et al. 2022); (2) the Modern-Era Retrospective Analysis for Research and Applications version 2 (MERRA-2, GMAO 2015; Gelaro et al. 2017) daily SWE fields; (3) SWE output from the ERA5-Land analysis (Muñoz Sabater 2019); and (4) the physical snowpack model Crocus (Brun et al. 2013) driven by ERA5 meteorological forcing. Availability of climate station snow data limits the accuracy of the Snow CCI SWE product during May and June, hence we only use it during March and April. An approach using gridded products is required because in situ observations alone are too sparse to be representative of hemispheric snow conditions, especially in the Arctic where stations are particularly sparse. We consider multiple datasets because averaging multiple SWE products has been shown to be more accurate than individual datasets when validated with in situ observations (Mortimer et al. 2020). The ensemble-mean SWE field is used to calculate monthly SWE anomalies relative to the 1991-2020 period, which are presented as percent differences. For April, the SWE fields for each product are also aggregated across Arctic land regions (> 60° N) for both North American and Eurasian sectors to produce multiple estimates of April snow mass. These monthly snow mass values are used to calculate standardized anomalies relative to the 1991-2020 period for each data product. The standardized anomalies are then averaged to produce an ensemble-mean time series.
Acknowledgments
ERA5-Land data (Muñoz Sabater 2019) were downloaded from the Copernicus Climate Change Service (C3S) Climate Data Store. The results contain modified Copernicus Climate Change Service information 2020. Neither the European Commission nor ECMWF is responsible for any use that may be made of the Copernicus information or data it contains.
References
Brown, R. D., and C. Derksen, 2013: Is Eurasian October snow cover extent increasing? Environ. Res. Lett., 8, 024006, https://doi.org/10.1088/1748-9326/8/2/024006.
Brown, R., and Coauthors, 2017: Arctic terrestrial snow cover. In: Snow, Water, Ice and Permafrost in the Arctic (SWIPA) 2017. pp. 25-64. Arctic Monitoring and Assessment Programme (AMAP), Oslo, Norway.
Brun, E., V. Vionnet, A. Boone, B. Decharme, Y. Peings, R. Valette, F. Karbou, and S. Morin, 2013: Simulation of Northern Eurasian local snow depth, mass, and density using a detailed snowpack model and meteorological reanalyses. J. Hydrometeor., 14, 203-219, https://doi.org/10.1175/JHM-D-12-012.1.
Estilow, T. W., A. H. Young, and D. A. Robinson, 2015: A long-term Northern Hemisphere snow cover extent data record for climate studies and monitoring. Earth Syst. Sci. Data, 7, 137-142, https://doi.org/10.5194/essd-7-137-2015.
Gelaro, R., and Coauthors, 2017: The Modern-era retrospective analysis for research and applications, Version 2 (MERRA-2). J. Climate, 30, 5419-5454, https://doi.org/10.1175/JCLI-D-16-0758.1.
GMAO (Global Modeling and Assimilation Office), 2015: MERRA-2tavg1_2d_lnd_Nx:2d, 1-Hourly, Time-Averaged, Single-Level, Assimilation, Land Surface Diagnostics V5.12.4, Goddard Earth Sciences Data and Information Services Center (GESDISC), accessed: 16 August 2022, https://doi.org/10.5067/RKPHT8KC1Y1T.
Luojus, K., and Coauthors, 2022: ESA Snow Climate Change Initiative (Snow_cci): Snow Water Equivalent (SWE) level 3C daily global climate research data package (CRDP) (1979 – 2020), version 2.0. NERC EDS Centre for Environmental Data Analysis, accessed: 16 August 2022, https://doi.org/10.5285/4647cc9ad3c044439d6c643208d3c494.
Meredith, M., and Coauthors, 2019: Polar Regions. IPCC Special Report on the Ocean and Cryosphere in a Changing Climate, H. -O. Pörtner, and co-editors, in press, https://www.ipcc.ch/srocc/.
Mortimer, C., L. Mudryk, C. Derksen, K. Luojus, R. Brown, R. Kelly, and M. Tedesco, 2020: Evaluation of long-term Northern Hemisphere snow water equivalent products. Cryosphere, 14, 1579-1594, https://doi.org/10.5194/tc-14-1579-2020.
Mudryk, L. R., P. J. Kushner, C. Derksen, and C. Thackeray, 2017: Snow cover response to temperature in observational and climate model ensembles. Geophys. Res. Lett., 44, 919-926, https://doi.org/10.1002/2016GL071789.
Mudryk, L., M. Santolaria-Otín, G. Krinner, M. Ménégoz, C. Derksen, C. Brutel-Vuilmet, M. Brady, and R. Essery, 2020: Historical Northern Hemisphere snow cover trends and projected changes in the CMIP6 multi-model ensemble. Cryosphere, 14, 2495-2514, https://doi.org/10.5194/tc-14-2495-2020.
Muñoz Sabater, J., 2019: ERA5-Land hourly data from 1950 to present. Copernicus Climate Change Service (C3S) Climate Data Store (CDS), accessed 8 September 2022, https://doi.org/10.24381/cds.e2161bac.
Robinson, D. A., T. W. Estilow, and NOAA CDR Program, 2012: NOAA Climate Data Record (CDR) of Northern Hemisphere (NH) Snow Cover Extent (SCE), Version 1 [r01]. NOAA National Centers for Environmental Information, accessed: 16 August 2022, https://doi.org/10.7289/V5N014G9.
U.S. National Ice Center, 2008: IMS Daily Northern Hemisphere Snow and Ice Analysis at 1 km, 4 km, and 24 km Resolutions, Version 1. Boulder, Colorado USA. NSIDC: National Snow and Ice Data Center, accessed: 22 Aug 2022, https://doi.org/10.7265/N52R3PMC.
November 10, 2022