
J. E. Walsh1, S. Bigalke2, S. A. McAfee3, R. Lader1, M. C. Serreze4, and T. J. Ballinger1
1International Arctic Research Center, University of Alaska Fairbanks, Fairbanks, AK, USA
2Plants, Soils and Climate Department, Utah State University, Logan, UT, USA
3Department of Geography, University of Nevada Reno, Reno, NV, USA(
4National Snow and Ice Data Center, University of Colorado Boulder, Boulder, CO, USA
Highlights
- Wetter-than-normal conditions predominated over much of the Arctic during the October 2021 through September 2022 water year, which was the 3rd wettest of the past 72 years.
- A significant increase in Arctic precipitation since the mid-20th century is now detectable across seasons and datasets.
- Significant increases in heavy precipitation events are detectable in the North Atlantic subarctic, while much of the central Arctic shows increases in consecutive wet days and decreases in consecutive dry days.
Introduction
Globally, precipitation over land has likely increased since 1950, consistent with increases in total atmospheric moisture (IPCC 2021). Climate models project an increase in Arctic precipitation, a transition from snowfall- to rainfall-dominated climates, and a higher frequency of heavy precipitation events (e.g., Sillmann et al. 2013; Kusunoki et al. 2015; McCrystall et al. 2021). However, previous assessments of precipitation and precipitation extremes across the Arctic over the period of observations have not shown coherent trends (Walsh et al. 2020). Results depend on the time period, the region examined, and the data sources (in situ gauge records, satellite retrievals, output from atmospheric reanalysis).
Gauge measurements of precipitation are especially problematic in the Arctic, where challenges include the sparse gauge network itself, which is unable to provide representative measurements in many northern regions. Moreover, precipitation gauges are known to suffer from undercatch of snow in cold, windy conditions (Ye et al. 2021). For this reason, gridded reanalysis products are increasingly used to assess variations and the expected emergence of trends in Arctic precipitation. For example, Yu and Zhong (2021) and White et al. (2021) used the ERA-Interim and ERA5 reanalyses, respectively, to show that trends of Arctic precipitation vary regionally and seasonally over the past few decades. In this essay, we use the more recent and more highly regarded ERA5 reanalysis to provide an annual and seasonal overview of the 2021/22 water year (October 2021-September 2022) Arctic precipitation anomalies and place these anomalies into a context of recent and ongoing changes.
2021/22 water year precipitation at a glance
The Arctic experienced notable precipitation anomalies in the 2021/22 water year. The outstanding features were (1) a predominance of positive seasonal departures from the climatological means and (2) shorter-duration heavy precipitation that broke existing records at various locations within the Arctic. Overall, the pan-Arctic (north of 60° N) precipitation for the 2021-22 water year in the ERA5 reanalysis was the 3rd highest since 1950, trailing only the 2019/20 and 2017/18 water years. The Arctic autumn, winter, and summer all ranked among the 10 wettest of their corresponding seasons in the post-1950 period.
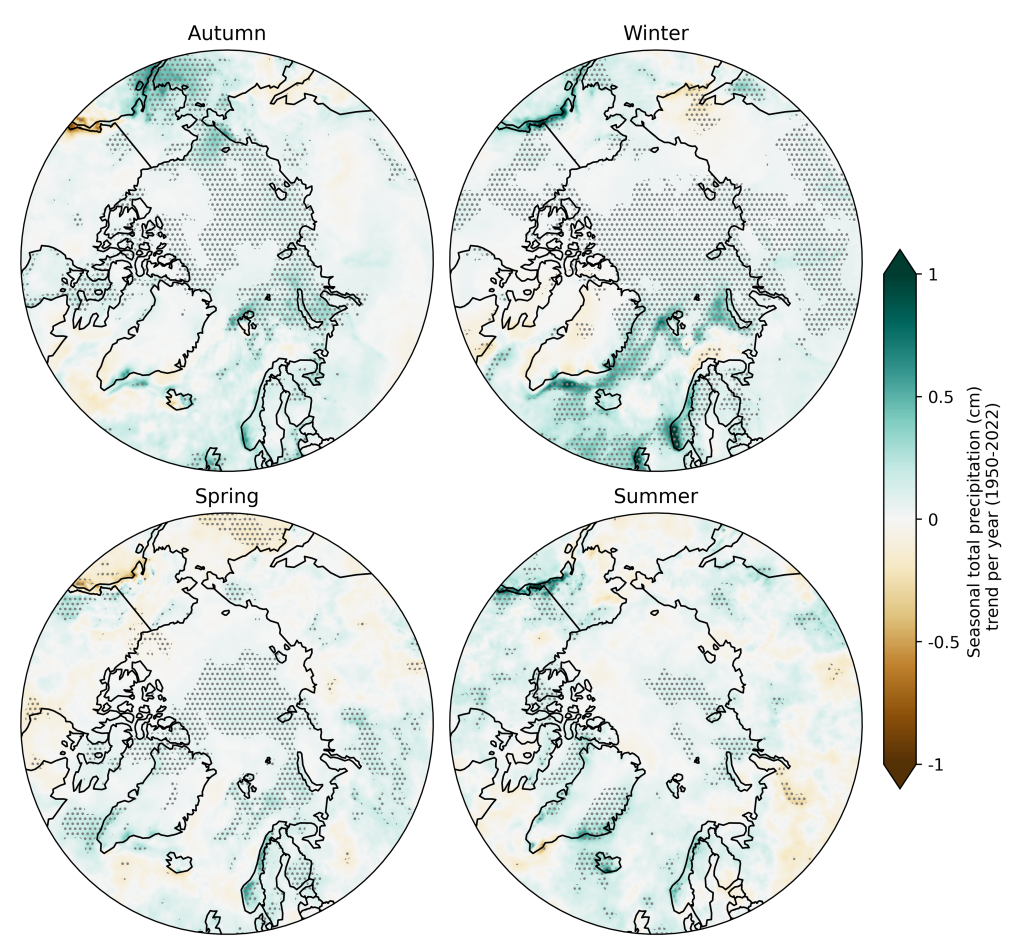
Figure 1 shows the ERA5-derived seasonal departures from the 1991-2020 means. For the October-December (OND) period, large positive departures are apparent in the Bering Sea extending into Interior Alaska and also along the western coast of Norway. Weaker positive departures are the rule over much of northern Russia and northeastern Canada. The Alaska anomalies are consistent with an anomalous ridge of high pressure south of the Aleutian Islands, with a corresponding eastward flux of moisture across the Bering Sea into Alaska (see essay Surface Air Temperature, Fig. 3a). The positive departures over northern Asia were associated with below normal pressures over the region and may have been augmented by enhanced moisture availability during the increasingly long open water seasons in the seas north of Eurasia. Among notable heavy events, Bergen, Norway broke its October precipitation record and new records for December precipitation were set at Fairbanks in Interior Alaska and at Nome on the western Alaska coast. Fairbanks also experienced a high-impact freezing rain event with more than 3 cm of total precipitation (rain plus melted snow) on 26 December, nearly twice the monthly average.

The primary features of the January-March (JFM) pattern are broad areas of positive precipitation departures from normal in the North Atlantic subarctic, the Gulf of Alaska, and the southeastern Alaska panhandle. The positive departures over Alaska link to anomalously high pressure over western Canada and low pressure anomalies farther offshore (see essay Surface Air Temperature, Fig. 3b). The positive precipitation departures extending from Greenland to Norway were attributable to winter storm events. Seasonally-averaged sea level pressures were more than 5 hPa below average from northeastern Canada to northern Europe, indicative of an active cyclone pattern in the Atlantic sector of the Arctic. A late-January storm set 32 records for heavy precipitation in Norway and contributed to the positive seasonal departures there in the winter panel of Fig. 1. The autumn and winter precipitation anomalies point to the importance of large-scale circulation in controlling the regional distribution of Arctic precipitation.
Spring is normally dry in the Arctic, and the April-June (AMJ) period of 2022 was characterized by generally small departures from the relatively low seasonal means (Fig. 1). Correspondingly, the atmospheric circulation anomalies were relatively weak (see essay Surface Air Temperature, Fig. 3c). For the 60-90° N region as a whole, AMJ precipitation was very close to the 1951-2022 median. A notable feature of Fig. 1’s spring panel is the broad area of negative (dry) departures extending across the North American subarctic from northeastern Canada to Alaska. Positive sea level pressure anomalies coincided with this broad band of dry conditions (see essay Surface Air Temperature, Fig. 3c). The dry conditions are especially apparent in central and southern Alaska, where all three months (April-June) had well below-normal precipitation. Drought conditions developed during May over southwestern Alaska and northern Cook Inlet. Moderate drought conditions expanded into much of Interior Alaska in June, setting the stage for severe wildfires in the early summer season.
Finally, the summer (JAS) was characterized by contrasting extremes (Fig. 1), with wet conditions predominating. Overall, the Arctic’s summer was the 3rd wettest of the past 72 years. Southeastern and southern Alaska were exceptionally wet with some locations recording their wettest JAS period on record. Western Alaska experienced heavy rain and coastal flooding from ex-typhoon Merbok in late September. New monthly records for July rainfall were set at various locations in northern Norway, including Holt, Harstad, Grunnfarnes, and Skibotn. However, very dry conditions prevailed over parts of northern Canada and northeastern Europe, contributing to low water levels in rivers of eastern Europe.
Historical variations and trends
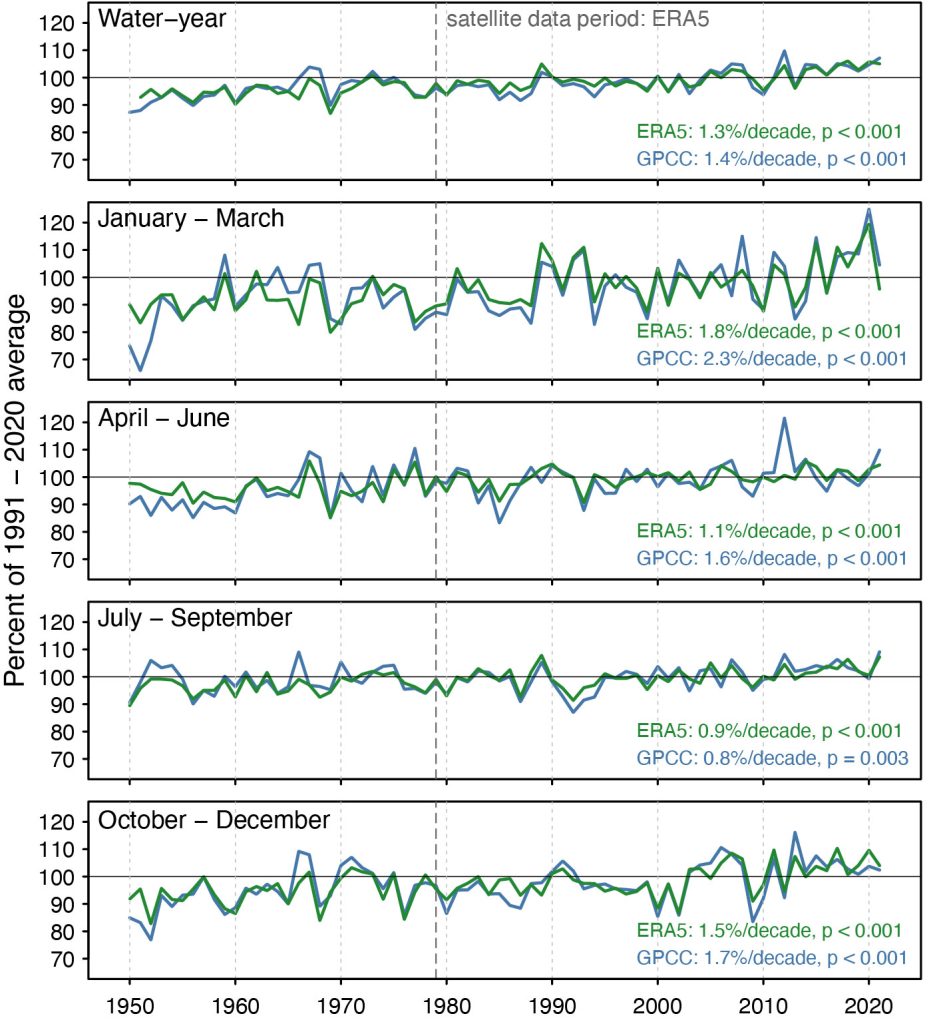
Figure 2 compares time series of seasonal precipitation from ERA5 and the station-based dataset of the Global Precipitation Climatology Center (GPCC) during 1950-2021. While there is considerable interannual variability, these variations are generally consistent across the two datasets. Both show increases of about 10% in the yearly total precipitation. Increases in both time series are smallest in the summer and most pronounced for winter. In all cases, the trends are statistically significant at the 0.01 level. The consistency of the trends across seasons and datasets argues that precipitation over the Arctic as a whole is increasing, as expected from climate model simulations. For the more recent period 1979-2021, when ERA5’s assimilation of satellite data increased, the trends in ERA5 (and also GPCC) precipitation are even larger and statistically significant for the full water year and for all seasons except AMJ. The AMJ trends for 1979-2021 are weaker than for 1950-2021 and insignificant in both datasets.
The spatial patterns of linear trends based on ERA5 are presented in Fig. 3. While there are scattered areas of decrease (brown shading) in every season, areas of increase (green shading) predominate. Consistent with the area-averaged trends in Fig. 2, nearly all areas of statistically significant change are increases. Increased precipitation is especially pronounced in the Bering Sea and southern Alaska during autumn, the subpolar North Atlantic during winter, and southeastern Alaska during winter and summer. The southwestern coast of Norway is dominated by increases in all seasons. A notable area of decrease is the Bering Sea during spring and summer.
Indicators of precipitation extremes
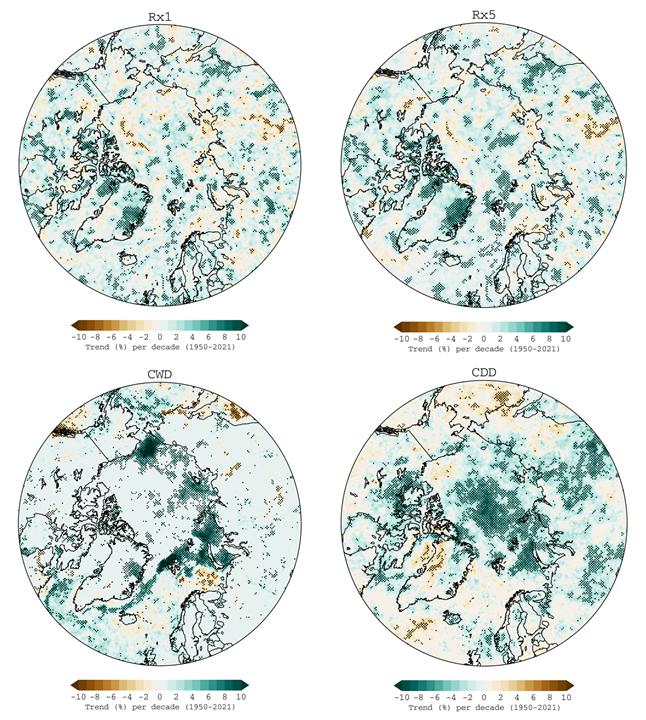
Heavy precipitation events based on ERA5, as captured by the yearly maximum 1-day (R×1) and 5-day precipitation (R×5), show no coherent trends over most of the Arctic, although large and significant increases are apparent over eastern Greenland, Svalbard, and northern Norway (Fig. 4). These regions also show positive trends in total precipitation (Fig. 3), indicating that heavy precipitation events are contributing to the overall increase in precipitation in these areas. By contrast, the annual maximum number of consecutive wet days (CWD) shows a broad area of increase from Svalbard eastward through the Siberian seas to the Chukchi Sea northwest of Alaska. This area of increase in CWD generally coincides with the area of reduced sea ice coverage during the warm season. Correspondingly, the annual maximum number of consecutive dry days (CDD) has decreased over much of the central Arctic as well as the Siberian shelf seas and north-central Siberia.
Methods and data
Because of the challenges of gauge measurements in the Arctic, we make use of gridded precipitation fields from both the ERA5 atmospheric reanalysis of the European Centre for Medium Range Weather Forecasts (ECMWF) (Hersbach at al. 2020) and the Global Precipitation Climatology Centre’s GPCC V. 2022 (Becker et al. 2013). ERA5 data are available from January 1950 onwards, but the quality of the output is more reliable starting in 1979 (Hersbach et al. 2020), after which modern satellite data are assimilated into the analysis and forecast system. ERA5 is the latest atmospheric reanalysis effort and performs slightly better than other atmospheric reanalyses at matching observed precipitation totals from extreme events in the eastern Canadian Arctic (Loeb et al. 2022). We use the entire 1950-2022 record to examine seasonal anomalies of the 2021-2022 water year, linear trends in total precipitation by season, and trends in extreme Arctic precipitation. Given the model-derived nature of ERA5, comparisons are made with the GPCC’s Full Data Product, a monthly gridded gauge-based product available from 1891-2020 (Schneider et al. 2022). A merged product that uses satellite retrievals is also available, but retrievals in the Arctic are known to be problematic. Statistical significance of the precipitation trends computed from both sources was evaluated using a Theil-Sen test (Hurtado 2020).
Acknowledgments
Rune Graversen, Brian Brettschneider, and Rick Thoman contributed information used in this essay.
References
Becker, A., P. Finger, A. Meyer-Christoffer, B. Rudolf , K. Schamm, U. Schneider, and M. Ziese, 2013: A description of the global land-surface precipitation data products of the Global Precipitation Climatology Centre with sample applications including centennial (trend) analysis from 1901-present. Earth Syst. Sci. Data, 5(1), 71-99, https://doi.org/10.5194/essd-5-71-2013.
Hersbach, H. B., and Coauthors, 2020: The ERA5 global reanalysis. Quart. J. Roy. Meteor. Soc., 146, 1999-2049, https://doi.org/10.1002/qj.3803.
Hurtado, S. I., 2020: RobustLinearReg: Robust Linear Regressions. R package version 1.2.0, https://CRAN.R-project.org/package=RobustLinearReg.
IPCC, 2021: Climate Change 2021: The Physical Science Basis. Contribution of Working Group I to the Sixth Assessment Report of the Intergovernmental Panel on Climate Change [Masson-Delmotte, V., et al. (eds.)]. Cambridge University Press, Cambridge, United Kingdom and New York, NY, USA, pp. 2-6, https://doi.org/10.1017/9781009157896, in press.
Kusunoki, S., R. Mizuta R., and M. Hosaka, 2015: Future changes in precipitation intensity over the Arctic projected by a global atmospheric model with a 60-km grid size. Polar Sci., 9, 277-292, https://doi.org/10.1016/j.polar.2015.08.001.
Loeb, N. A., A. Crawford, J. C. Stroeve, and J. Hanesiak, 2022: Extreme precipitation in the eastern Canadian Arctic and Greenland: An evaluation of atmospheric reanalyses. Front. Env. Sci., 10, 866929, https://doi.org/10.3389/fenvs.2022.866929.
McCrystall, M., J. Stroeve, M. C. Serreze, B. C. Forbes, and J. Screen, 2021: New climate models reveal faster and larger increases in Arctic precipitation than previously projected. Nat. Commun., 12(1), 6765, https://doi.org/10.1038/s41467-021-27031-y.
Schneider, U., P. Finger, E. Rustemeier, M. Ziese, and S. Hänsel, 2022: Global precipitation analysis products of the GPCC, https://opendata.dwd.de/climate_environment/GPCC/PDF/GPCC_intro_products_v2022.pdf.
Sillmann J., V. V. Kharin, F. W. Zwiers, X. Zhang, and D. Bronaugh, 2013: Climate extremes indices in the CMIP5 multimodel ensemble: Part 2. Future climate projections. J. Geophys. Res.-Atmos., 118, 2473-2493, https://doi.org/10.1002/jgrd.50188.
Walsh, J. E., T. J. Ballinger, E. S. Euskirchen, E. Hanna, J. Mård, J. E. Overland, H. Tangen, and T. Vihma, 2020: Extreme weather and climate events in northern areas: A review. Earth-Sci. Rev., 209, 103324, https://doi.org/10.1016/j.earscirev.2020.103324.
White, J., J. E. Walsh, and R. L. Thoman, Jr., 2021: Using Bayesian statistics to detect trends in Alaskan precipitation. Int. J. Climatol., 41(3), 2045-2059, https://doi.org/10.1002/joc.6946.
Ye, H., D. Yang, A. Behrangi, S. L. Stuefer, X. Pan, E. Mekis, Y. Dibike, and J. E. Walsh, 2021: Precipitation Characteristics and Changes. Chapter 2 in Arctic Hydrology, Permafrost and Ecosystems (D. Yang and D. L. Kane, Eds.), Springer Nature Switzerland, 914 pp., https://doi.org/10.1007/978-3-030-50930-9_2.
Yu, L., and S. Zhong, 2021: Trends in Arctic seasonal and extreme precipitation in recent decades. Theor. Appl. Climatol., 145, 1541-1559, https://doi.org/10.1007/s00704-021-03717-7.
January 6, 2023